Convert text to DateTime

Hello,

I am new to Dax. Can someone please help me converting text value to Date/Time?
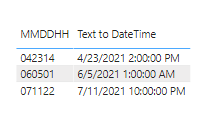
For example, 071122 (MMDDHH) has to be converted to Date/Time data type. I am not concerned about the format but just want Power Bi to recognize these numbers as date/time.

Please let me know if more information is needed.

Thank you very much!

1 Like

@gkhokher ,

Give this a go:

Text to DateTime =

VAR _Year = VALUE(YEAR(TODAY()))
VAR _Month = VALUE(LEFT( SELECTEDVALUE( 'Text Values'[MMDDHH] ), 2 ))
VAR _Day = VALUE(MID( SELECTEDVALUE( 'Text Values'[MMDDHH] ), 3, 2 ))
VAR _Hour = VALUE(RIGHT( SELECTEDVALUE( 'Text Values'[MMDDHH] ), 2 ))
VAR _Date = DATE( _Year, _Month, _Day )
VAR _Time = TIME( _Hour, 0, 0 )

VAR _Result = _Date + _Time

RETURN _Result

image

I hope this is helpful. Full solution file attached.

1 Like

Hi @BrianJ ,

Thank you for the help!

But I am getting this error:
image

Can you please help me figure out what am I missing?

@gkhokher ,

Be sure to turn off the totals on your visual. That’s where the error is coming from - it should run fine with no totals.

EDIT: I just refined the RETURN statement to trap that error even if you don’t turn the totals off:

Text to DateTime =
VAR _Year = VALUE(YEAR(TODAY()))
VAR _Month = VALUE(LEFT( SELECTEDVALUE( 'Text Values'[MMDDHH] ), 2 ))
VAR _Day = VALUE(MID( SELECTEDVALUE( 'Text Values'[MMDDHH] ), 3, 2 ))
VAR _Hour = VALUE(RIGHT( SELECTEDVALUE( 'Text Values'[MMDDHH] ), 2 ))
VAR _Date = DATE( _Year, _Month, _Day )
VAR _Time = TIME( _Hour, 0, 0 )

VAR _Result = _Date + _Time

RETURN

IF(HASONEVALUE( 'Text Values'[MMDDHH] ), _Result, BLANK() )

image

  • Brian

Hi @BrianJ ,

Now the error is gone but all the values are blank…

image

Hi @BrianJ ,

Removed the SELECTEDVALUE from the formula and it started working…
So the formula that worked is:

Text to DateTime =
VAR _Year = VALUE(YEAR(TODAY()))
VAR _Month = VALUE(LEFT( ( ‘Text Values’[MMDDHH] ), 2 ))
VAR _Day = VALUE(MID( ( ‘Text Values’[MMDDHH] ), 3, 2 ))
VAR _Hour = VALUE(RIGHT( ( ‘Text Values’[MMDDHH] ), 2 ))
VAR _Date = DATE( _Year, _Month, _Day )
VAR _Time = TIME( _Hour, 0, 0 )

VAR _Result = _Date + _Time

RETURN _Result

Thank you very much for your help!! :smiley:

@gkhokher ,

I’m assuming you did it is a calculated column above. Unless you plan on slicing on that column or using it as the axis on a visual, I would recommend keeping it as a measure with the SELECTEDVALUE in place.

  • Brian

@BrianJ ,

I tried it as measure but it was giving me the same error.

image

@gkhokher ,

Can you please post your PBIX work in progress file? It works fine when I run it, so I’d like to see where it’s falling down on your model.

Thanks.

– Brian

@BrianJ ,

Attached is the file:

Production EfficiencyFINAL.pbix (3.0 MB)

@ghokher,

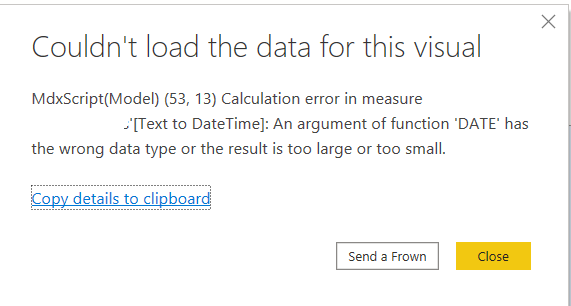
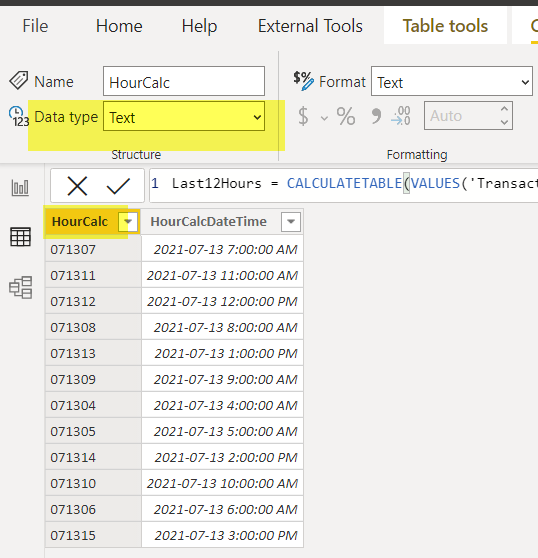
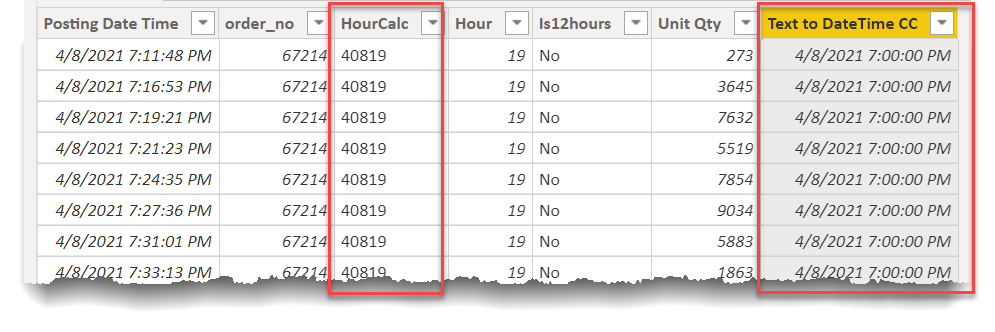
OK - I see the problem - you’ve got Transactions[Hourcalc] coming in as a whole number, rather than text. Because of that, you’re losing the leading zero on single digit months. We need to fix that, either in PQ (preferable) or DAX. If you can please post the underlying data file, I can show you how to write a simple M function to fix this

  • Brian

@BrianJ ,

It shows as Text in Data View. Cannot it work without using SELECTEDVALUE or I have to have it in the formula?

@gkhokher ,

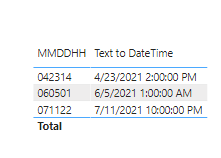
Okay, this should be bulletproof. Create this as a measure, and it shouldn’t matter whether you have the leading zero or not, or whether you’ve got totals turned on or off in your visual. .

Text to DateTime =
VAR _SelHourCalc = SELECTEDVALUE( Transactions[HourCalc] )
VAR _6Char = IF( LEN(_SelHourCalc) = 6, _SelHourCalc, "0" & _SelHourCalc )
VAR _Year = VALUE(YEAR(TODAY()))
VAR _Month = VALUE(LEFT( _6Char, 2 ))
VAR _Day = VALUE(MID( _6Char, 3, 2 ))
VAR _Hour = VALUE(RIGHT( _6Char, 2 ))
VAR _Date = DATE( _Year, _Month, _Day )
VAR _Time = TIME( _Hour, 0, 0 )

VAR _Result = _Date + _Time

RETURN
IF(HASONEVALUE( Transactions[HourCalc] ), _Result, BLANK() )
1 Like

Hi @BrianJ ,

The error is gone now but I need to use this measure in graph (Sparkline) which is created using Dax for all the records in table (one graph per record line in table). If I use this formula, the graphs disappears.
The solution that is working for me is this:

VAR _Year = VALUE(YEAR(TODAY()))

VAR _Month = VALUE(LEFT( ( ‘Tablename’[HourCalc] ), 2 ))

VAR _Day = VALUE(MID( ( ‘Tablename’[HourCalc] ), 3, 2 ))

VAR _Hour = VALUE(RIGHT( ( ‘Tablename’[HourCalc] ), 2 ))

VAR _Date = DATE( _Year, _Month, _Day )

VAR _Time = TIME( _Hour, 0, 0 )

VAR _Result = _Date + _Time

RETURN _Result

Thank you!!

@gkhokher ,

Yes, I mentioned above that if you are going to be slicing on this field or using it as the axis in a visual, you will need to use a calculated column (or do it initially in PQ).

The choice is yours, but per calculated column, I would go with the code below since it is protective of the leading zero getting dropped which is what happens when I open your file.

Here’s my suggested calc column code:

Text to DateTime CC =

VAR _6Char = IF( LEN(Transactions[HourCalc]) = 6, Transactions[HourCalc], "0" & Transactions[HourCalc])
VAR _Year = VALUE(YEAR(TODAY()))
VAR _Month = VALUE(LEFT( _6Char, 2 ))
VAR _Day = VALUE(MID( _6Char, 3, 2 ))
VAR _Hour = VALUE(RIGHT( _6Char, 2 ))
VAR _Date = DATE( _Year, _Month, _Day )
VAR _Time = TIME( _Hour, 0, 0 )

VAR _Result =  _Date + _Time

RETURN
_Result

Revised solution file posted below.

Hi @gkhokher, did the response provided by @BrianJ help you solve your query? If not, how far did you get and what kind of help you need further? If yes, kindly mark as solution the answer that solved your query. Thanks!