I have a list of 17,910 prospects that have all been loaded into our Salesforce database. In Salesforce, each prospect is classified as a Lead or a Contact and within each of those, there is a status indicating where the prospect is in the sales funnel. I merged the prospect list with our Salesforce Lead and Contact objects to bring all information into one query called ‘Prospect List Contact Lead’.
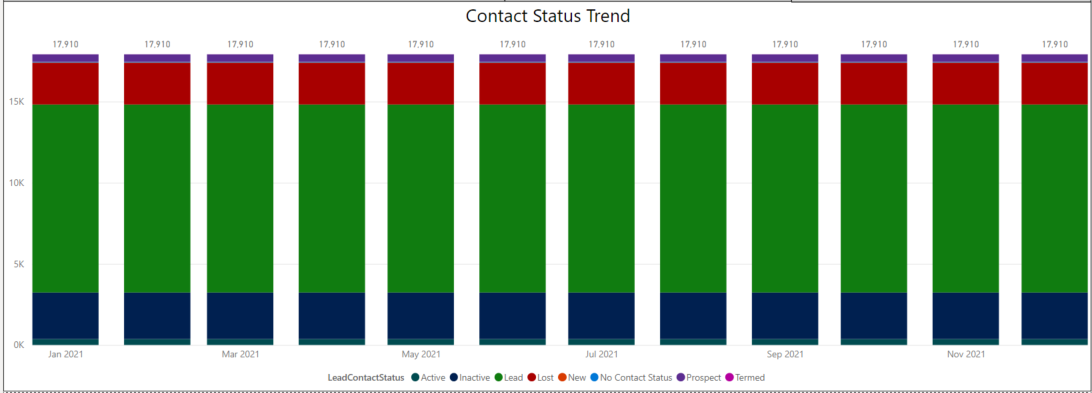
Our sales team is working the prospect list and I’ve been asked to create a trend over time of the status changes in salesforce, both for leads and contacts. My goal is to create the chart below. Right now all leads are classified as leads but my ideal would be to break the leads up by status as well.
However, I can’t figure out which date to relate the prospect file to in order to get the mix of status types in each month. The mix of each status type should change month to month as the sales team works the list but as you can see, it’s the same for every month right now because I don’t have it related to any date query.
You’ll see in my file that I have both a contact and lead history file. These files show when a contact or lead status changed. In the ‘Prospect List Contact Lead’ query, you’ll also see a contact created date and other dates like the date of the last modification, last activity, etc. but none of these gets me to where I want to be.
Please let me know if you have any questions. Pbix file is attached.
Taking a look at your model, I can see why this has been difficult for many users to tackle.
the only connections shown in your model are bi-directional, many-to-many relationships.
This can cause a LOT of confusion in your data, with a bi-directional relationship, the Prospect List Contact Lead can filter both Lead History and Contact History - but both of those tables can also filter that table.
This makes sense, as Prospect List Contact Lead appears to be a table created in your model.
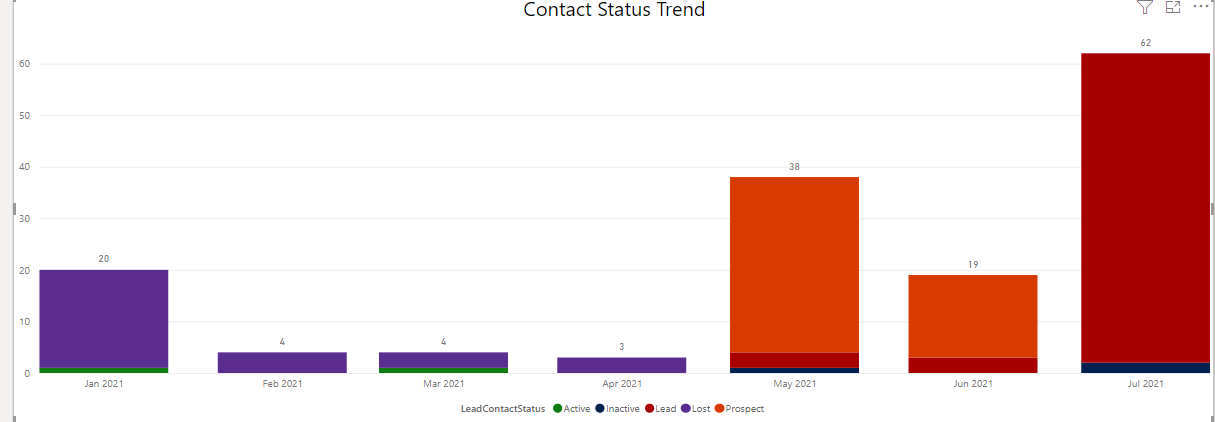
Not knowing your data, I ASSUME that the important date here is the “Lead Status Change”, but you have mentioned that none of the dates gets you where you want to be. (here is what the chart looks like with that date connection)
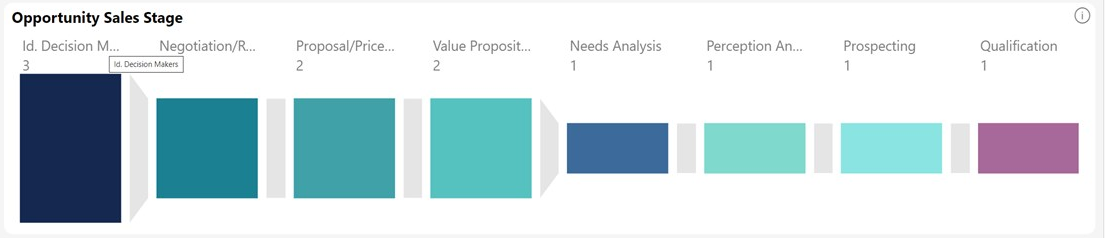
Or, an alternative (doing a bit of research in PowerBi Apps, there is a pre-built app called “Salesforce Analytics for Sales Managers” - which includes more of a funnel overview of the data:
Thanks Heather! The marketing and sales teams really want to be able to track the status changes over time. I already have the current mix but I need to be able to track how that mix has changed to see if the sales team is working the leads. Sheila
Hi Heather, The ideal chart would show the status mix of all 17,910 prospects each month. Each month the mix will change as sales works the list. It would look like the chart I inserted in my initial question except that the mix would change. Thanks! Sheila
In order to do this, your data (or measure) would need to show the status for each of your prospects every month.
As I said before, I’m not familiar with the Salesforce dataset, can you explain which fields are relevant, or provide a simplified dataset?
Also, the bi-directional many-to-many relationships are concerning and will cause problems for you down the road.
The table ‘Prospect List Contact Lead’ contains two relevant fields, Contact.Status C and Lead (2).Status Lead. Each of these contains the current status of each prospect.
The tables ‘Contact History’ and ‘Lead History’ are log files of status changes. These tables show the old value and the new value with a created date for the change.
I created a relationship between the first table and the two history tables via the contact and lead ID fields.
The issue is that not every one of the prospects in the ‘Prospect List Contact Lead’ table have a status change in the history tables. What I need to do, which you already said, is figure out the status of each prospect at the end of each month. So if the status didn’t change, it just gets repeated as the same as current. I’m just really struggling with the DAX formula(s) to get there.
While our users and experts do as much as reasonable to help you with your inquiries, not all concerns can be attended to especially if there are some learnings to be done. Thank you!