Consecutively Short or Over and Multi condition

I’m trying to figure out how to highlight a product that has a consecutively negative or positive balance for 7 days, or 7 days of sales. I’m hoping to be able to toggle between looking at the data in past 30 days, past 14 days and past 7 days, but want the product to be flagged regardless of the date filter, for instance I would want it to show up if it occurred during the past 300 days, or whatever the date filter is sliced as.

I would be happy with a binary result (True/False) or something similar.

I attached some mock data and a pbix file.

Basically if the product has 7 days of sales where the over (positive) /short (negative), I want to display that product, location and warehouse.

Sample Data.xlsx (198.5 KB)

7-Day consecutive sample.pbix (97.4 KB)

I am trying to avoid virtual tables or adding conditional columns to my fact table because the actual dataset is quite large.

Thanks,

ibesmond

Answer : (?)
Good evening @ibesmond

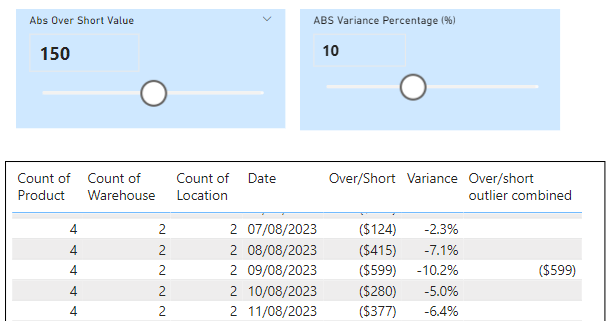
A possible workout for your dilemma 2: “Are there any Product/Location/Warehouse with over/short more than +/- $150, unless the variance is +/- 10%?” is presenting outliers.

Do you expect an integration of the two (variance and over/short) ? What do you mean with “unless” ?

PBIX attached:
7-Day consecutive sample (DS reaction).pbix (103.1 KB)

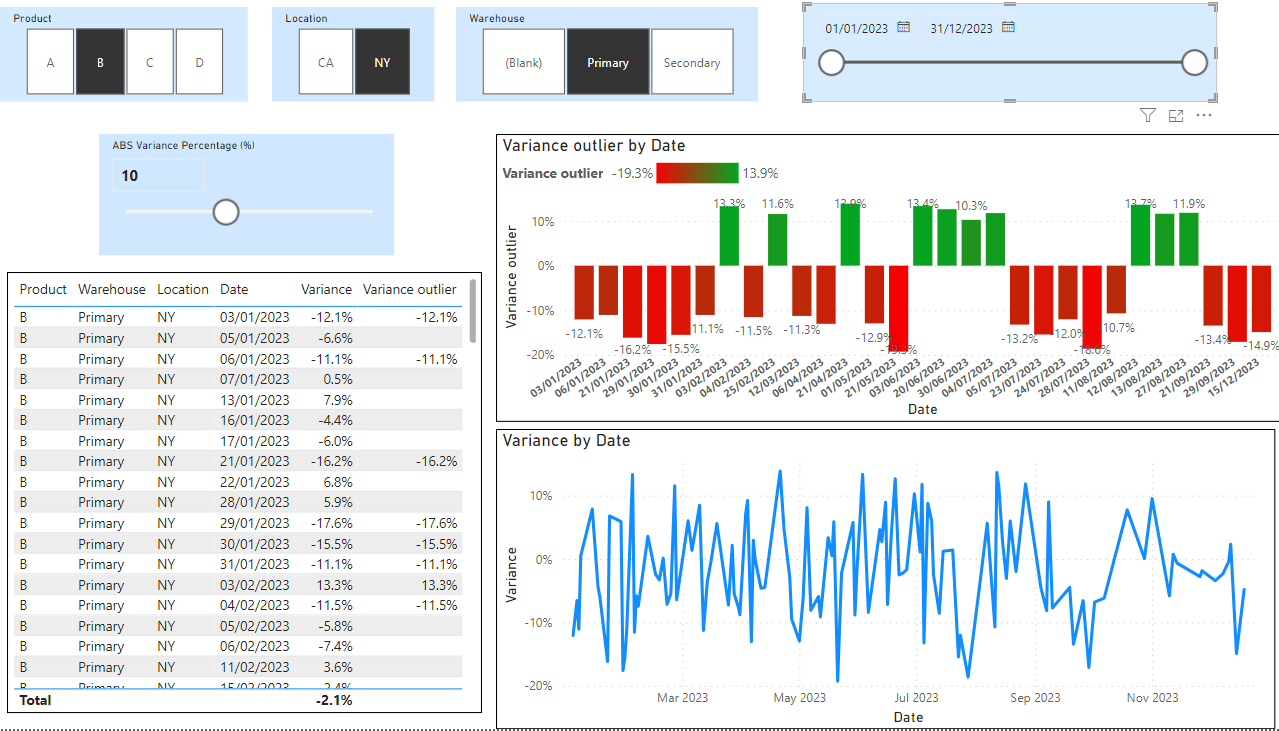
Set up of a possible outlier presentation, made for both Variance % and Over short balance.

  1. Add a parameter (Modeling – New Parameter), which adds a new slicer to select above which values the outliers should be presented, default set to 10 % and for the second to 150
Abs Variance Percentage% = GENERATESERIES(0, 25, 1)
ABS.Variance Percentage = SELECTEDVALUE('Abs Variance Percentage%'[ABS Variance Percentage (%)], 5)
  1. Create the outlier measure (1 of 2 presented)
Variance outlier = IF(abs([Variance]) >= [ABS.Variance Percentage] / 100  , [Variance],  BLANK())
  1. Add a table with data, comparing the variance % and the outlier variance % for verification

  2. Add a stacked column chart with the outlier variance % by date
    Formatting made in the graph :

  • visualisations – Format visual – Visual – X-axis – Type : set to Categorial, to present only dates with outlier values
  • visualisations – Format visual – Visual – Columns – Color – Color fx : set a red green color range, including automatic minimal and maximal variance %

Resulting in :

+++++++++++++++++++++++++++++++++++++++++++++++++++++++++++++++++++++++++

Dilemma 1 "Are there any Product/Location/Warehouse with over/short for 7 consecutive days?
( 7-day count should not include days with no sales or weekends) " is complex . .

Albert Ferrari has given an explanation of consecutive sales days, which can be found at https://www.youtube.com/watch?v=E5VZ6k9kk60

The complexity with Over / Short billing is that it a combination of two, Over and Short, which can not be compared to one item Sales as in the example. It interferes with each other. How should the combination be treated in the outcome, and different consecutive number values (150 Over, next -10 Short) are irrelevant? What is the exact definition of consecutive for the Over/short numbers ?


AF1 Consecutive days of sales = //Albert Ferrari https://www.youtube.com/watch?v=E5VZ6k9kk60
Var RefDate = MAX(DateT[Date])
Var AllDates = All (DateT[Date])
Var DatesWithSales = CALCULATETABLE(VALUES(FactTable[Date]),ALLSELECTED())
Var DateswithNoSales = EXCEPT(AllDates, DatesWithSales)
Var NearestHoleSales = MAXX( FILTER( DateswithNoSales, DateT[Date] <= RefDate),DateT[Date]) //can be empty if every day generates sales
Var MinimumDate = CALCULATE(MIN(DateT[Date]), REMOVEFILTERS(DateT[Date])) // DS needed if table "NearestHoleSales" is Empty
Var ResultConsecutiveSalesDays = if(ISBLANK(NearestHoleSales),INT(RefDate - MinimumDate+1),INT(RefDate - NearestHoleSales)) //when every day gives sales,(ISBLANK), consecutive sales is min date till ref.date
RETURN ResultConsecutiveSalesDays 

I hope this helps you a step further.
Kind regards Jan vd Wind

Hi Jan,

Dilemma 2:

Thanks for the detailed explanation and suggestions. In response to the outliers, I am trying to apply a double condition. So the first threshold it looks at is the +/- 150 over/short variance, however it is excluded from the outliers if the variance percentage meets the condition of less than +/- 10% of sales. I am probably going to refine these tolerance levels to factor for daily vs cumulative variances. We used to look at these monthly, so the tolerance level was created for that purpose, but I want to build something that can be referenced daily or weekly so I will probably adjust the tolerances for shorter time frames.

Dilemma 1: In this situation, I do not want to consider the tolerance levels from dilemma 2. The only thing I am interested in is seven consecutive days of under-billing, or seven consecutive days of over-billing (based on days of sales, such as to ignore for weekends or days without sales).

Thank you for the link to Albert’s video, and the included details. I haven’t come across it in my internet searches. I appreciate your time and help. Thank you again.

-Ian

Good evening @ibesmond

With your definition and a second thought, dilemma 2 is resolvable, including possible outlier selection of variance percentage and absolute values:

7-Day consecutive sample (DS reaction).pbix (104.9 KB)

Over/short outlier combined = 
IF(and( abs([Variance]) >= [ABS.Variance Percentage] / 100, 
        abs([Over/Short]) >= [Abs Over Short Value Value]) , [Over/Short],  BLANK())

Result of your dummy data, no selection made of location, WH or product

image

Thinking further about dilemma 1:

The concept explained by Albert Ferrari determines consecutive sales, based upon dates in a table.
As you have lots of transactions in the fact table, how to determine consecutive sales cq over-billing, and how to generate consecutive over-billing on a aggregated level ?
I tried to generate order dates with a virtual table within the measure (summarize), but that does not seem to work.
Hopefully it is possible, maybe asking the teacher ?
.
Kind regards,
Jan van der Wind