I have a question regarding the connection between two visuals.
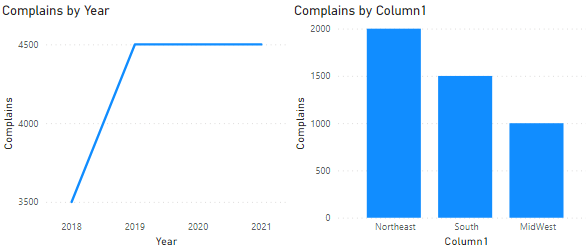
Visual is showing complaints by all years.
Visual is showing complaints by area but only for one year.
I would like the user to be able to click on one of the areas and see their complaints by all years displayed in the other graph. At the moment it is only showing the selected year but not all years.
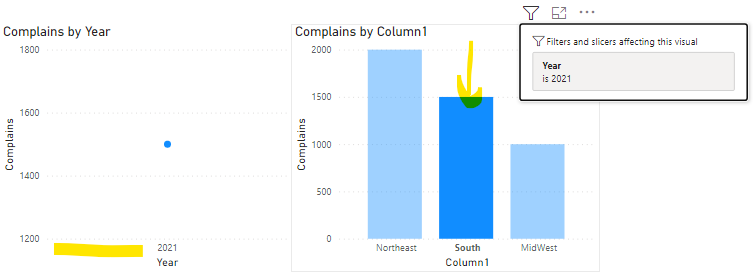
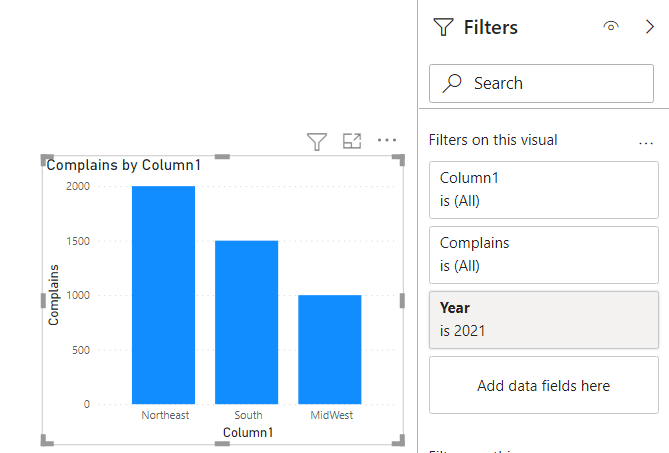
Well, you’re filtering your second visual by putting “Year = 2021” under the “FILTER PANE”. Below is the screenshot provided for the reference -
If you’re already filtering your second chart by putting the condition as “Year = 2021” than how you can expect the yearly results in the first chart when the second chart itself is being filtered by one year i.e. Year = 2021.
Once you remove the filter from the second chart and than click on any of the bar of the second visual and now’ll be able to see the yearly results getting filtered in the first chart. Below is the screenshot provided for the reference -
Hi Harsh, thank you very much for your answer.
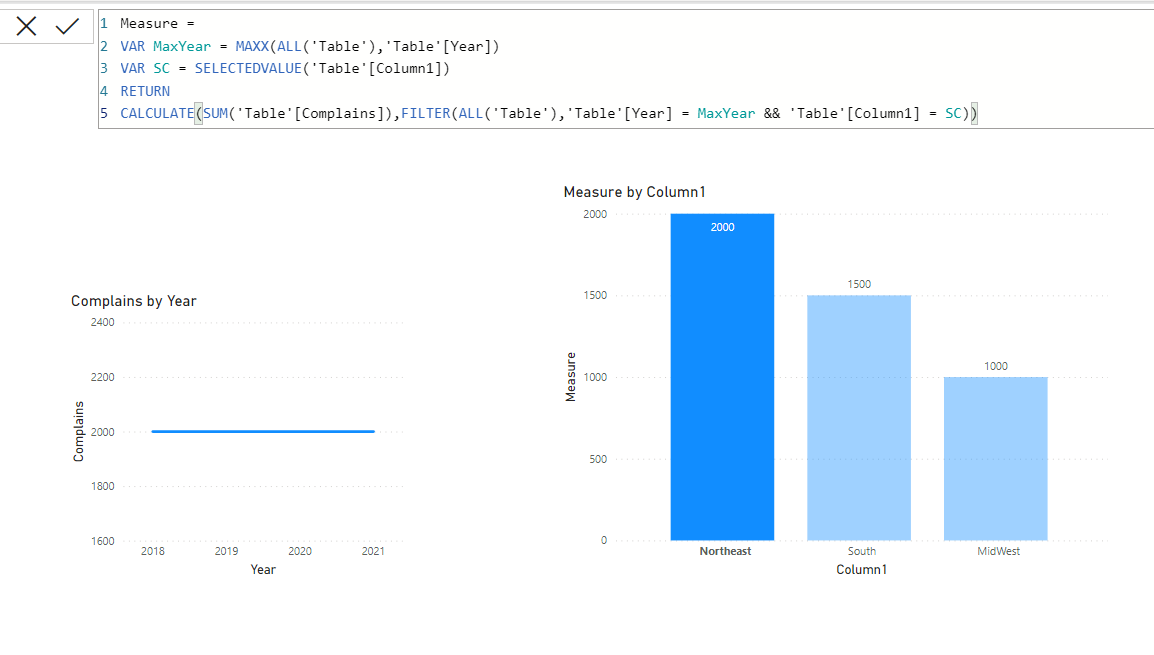
My problem is that I want to show only the latest year in the one chart and all three years in the year chart.
In your file the area chart is showing the sum of all years which is not really what I would like to show.
As suggested in my previous post, the second chart is already getting filtered from the “FILTER PANE” and now you’re making your first chart dependant on the second chart. So it’s but obvious that first chart will behave accordingly as per the context provided into the second chart which is it’s getting filtered by “YEAR = 2021”. So any selections you make into the second chart will by default convey that context to the other charts as well.
I recommend you to please go through some of the courses available onto the education portal.
The only thing that you can do is add a slicer onto the page and than make the selections that affects the first chart rather than making selections from the second chart. Because any selection made into the second chart will showcase the results only for one year i.e. 2021 and nothing else. And if you don’t want slicer having an effect onto the second chart than use “Edit Interactions” option to turn-off the effect of the slicer onto the second chart. Apart from this, I don’t see any alternative possible here in this case.
Hi @Reporting, did the response provided by the users and experts help you solve your query? If not, how far did you get and what kind of help you need further? If yes, kindly mark as solution the answer that solved your query. Thanks!
Hi @Reporting, did the response provided by @Rajesh and @Harsh help you solve your query? If not, how far did you get and what kind of help you need further? If yes, kindly mark as solution the answer that solved your query.
I hope that you are having a great experience using the Support Forum so far. Kindly take time to answer the Enterprise DNA Forum User Experience Survey, we hope you’ll give your insights on how we can further improve the Support forum. Thanks!