Conditional Formatting Above/Below The Avg Value

Hi,
I need some help with DAX / conditional formatting.

We have a survey for employees. The survey is a total of 32 questions, which provides data across 8 dimensions. Each dimension has 4 separate questions.

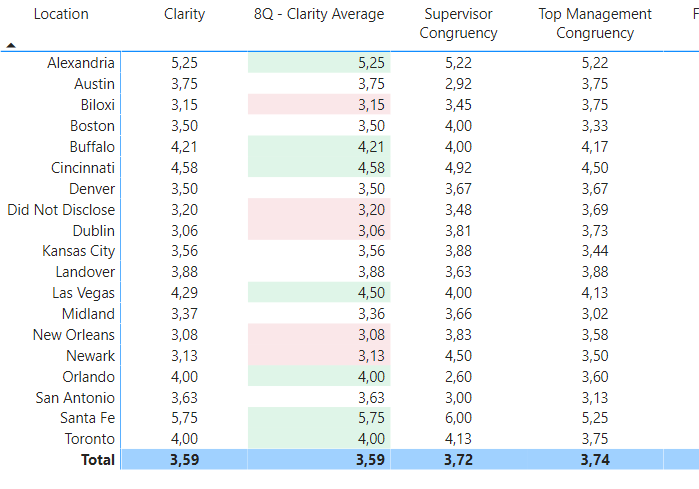
I have a table with rows of company locations, and columns of each dimension. The intersection of a dimension and location is the average score of that dimension at that location.

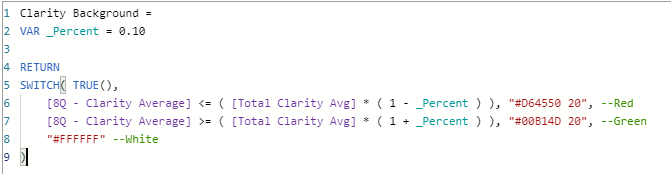
I would like to conditionally format a value of a location with green shading if it is more than 10% above the overall average of the dimension, and red shading if it is more than 10% below the overall average of the dimension.

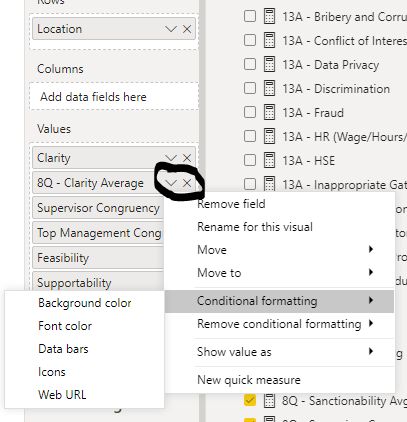
My values for the table are configured as follows (four questions equate to one dimension):

First I create a measure for the SUM of the survey score of each question (my numerator):
Q01 Num = SUM(‘Ethical Pulse - Raw Data’[Question 1.])
Q02 Num = SUM(‘Ethical Pulse - Raw Data’[Question 2.])
Q03 Num = SUM(‘Ethical Pulse - Raw Data’[Question 3.])
Q04 Num = SUM(‘Ethical Pulse - Raw Data’[Question 4.])

Then I create a measure for the COUNT of the number of responses to each question (my denominator):
Q01 Den = COUNTA(‘Ethical Pulse - Raw Data’[Question 1.])
Q02 Den = COUNTA(‘Ethical Pulse - Raw Data’[Question 2.])
Q03 Den = COUNTA(‘Ethical Pulse - Raw Data’[Question 3.])
Q04 Den = COUNTA(‘Ethical Pulse - Raw Data’[Question 4.])

Then I create a measure for the value of the Overall Dimension average:

Dimension Avg Value = ROUND ( DIVIDE ( Q01 Num + Q02 Num + Q03 Num + Q04 Num),(Q01 Den + Q02 Den + Q03 Den + Q04 Den),0),2)

I do not claim that what I’ve done above is the right / best way to do this. Honestly, I think I may be making it much harder / complicated than it needs to be. Nevertheless, this is as far as I’ve gotten. I have a table with the data that I’m expecting, I just need to figure out how to conditionally format it.

I would appreciate it if someone could suggest what I should do from here? Is there a specific set of DAX training in EDNA that would help me learn what the right solution is? If I can at least get a conceptual idea of what I need to do to solve this, that would be very much appreciated. Thank you!

Hi,

You can check below blog it may help you :

Thanks,
Anurag

Hi @trey.cook,

It would be easier for us to help you if you could provide a PBIX file :wink:

Best regards,
Joaly

Hi @trey.cook, welcome to the forum! :slight_smile:

Glad to see your first post, however, I noticed you didn’t provide a PBIX file. Providing one will help users and experts find a solution to your inquiry faster and better.

A perfect initial question includes all of the following:

  • A clear explanation of the problem you are experiencing

  • A mockup of the results you want to achieve

  • Your current work-in-progress PBIX file

  • Your underlying data file (to allow us to go into Power Query if necessary to transform your data and/or data model – often DAX questions really end up being data modeling solutions)

Check out this thread on Tools and Techniques for Providing PBIX Files with Your Forum Questions

Not completing your data may sometimes cause delay in getting an answer.

Hi Joaly,

I apologize for taking so long to get back with you - I just needed to dummy up my data a little bit more. Please find attached a .pbix file. I appreciate any assistance you can render.

Best Regards,

Trey
Ethical Pulse v7 - Test Data.pbix (3.6 MB)

Hi @trey.cook,

To help you on your problem I’ve created several measure.

First, I’ve created your average measure in an another way in order to have less measure at the end.
1/ Create the average for all the questions

2/ Calculate the average of your category that assemblies several questions
image

This solution will reduce considerably the number of measures :slight_smile:

Here is my measure inside your table

Then the second step is to calculate the average of the column (3.59 for Clarity)
image
It will return 3.59 on all rows.

Finally you need to create a measure for the color of the background.
image
If you want to change the colors, you just need to find the HEX code of the desired colors :wink:
The number after the space in the HEX code is the transparency (here I choose 20%).

You could also choose dynamically the percent (here 10%) by creating a parameter and then call your parameter in the measure above (in the VAR).

The final step is to create a conditional formatting on the 8Q - Clarity Average measure.
image
image

You can find the full solution here.
Ethical Pulse v7 - Test Data.pbix (3.5 MB)

I’ve only created the measures for the “Clarity” category, but you can do the same for all the others questions / categories.

I hope this solution will help you.

Best regards,
Joaly

3 Likes

Hi Joaly,

This is great! I can’t thank you enough for taking the time to help improve my measures and also to help me understand how to create the measure that formats the background color. You’ve also given me some good homework to try and setup the dynamic percentage with the parameter. :thinking: :grin:

Thank you very much for your help with this!

All the best,

Trey

2 Likes

Thank you for taking time to explain this beautifully @JBocher :slight_smile:

@trey.cook, good to see that you are having progress with your inquiry. Did the response above help you solve your inquiry?

If not, how far did you get and what kind of help you need further? If yes, kindly mark as solution the answer that solved your query.

1 Like

Thanks EDNA team for the prompt to mark the solution! It indeed solved my problem.