Component Forecast from Orders and BOMs

Hi everyone.

I’m trying to build a component forecast based on the order quantity.
I’m struggling with how to setup the data model as well as DAX. I attached a very simple sample of the data.

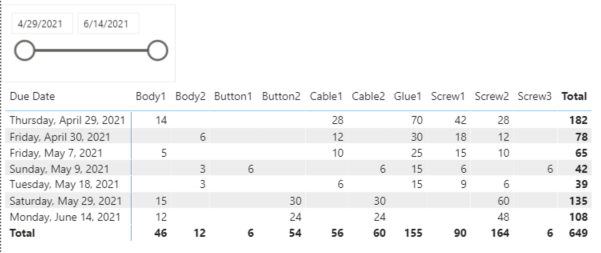
My goal is to have a date slicer and list all the components needed for that date period.
I want to see the total demand for each component.

Here’s the issues I’m running in:

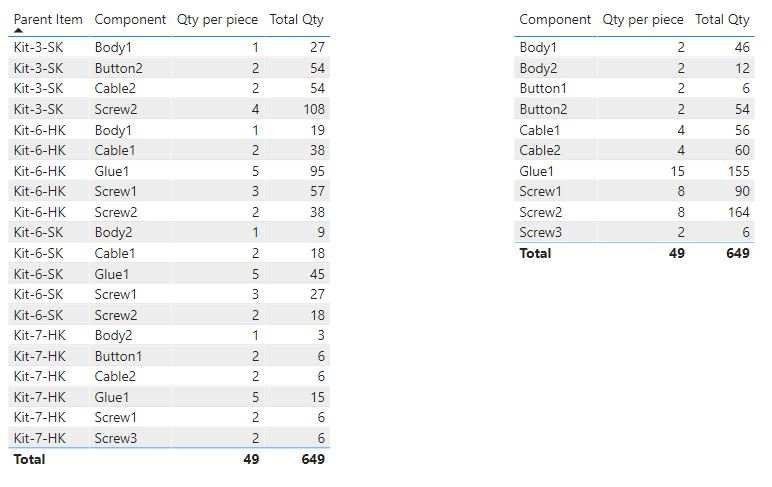
  • If I connect the BOM and Orders table via the item number, I have a many to many relationship
  • If I use a Item table as a lookup table, I’m not able to calculate the total demand for each component (lack of skill). In this case I would need some help figuring out the DAX.
  • If I merge the queries, it might get a little hard on the computer since both tables are much bigger

What’s the best way you would suggest to accomplish this?

Thanks,
Nico

Report Boms.pbix (48.7 KB)

Nico, I believe you can do a merge query to let Order left outer join BOM to get the proper component breakdown of the orders.
image
Here is the pbix you may try:
Report Boms ans.pbix (62.6 KB)

Hi @nico,

Added an Item lookup table to your model.
Marked your Date table as a Date table, and changed the 1:1 into a 1:M

Created 2 measures:

Order Qty = SUM( Orders[Qty] )
.

Total Qty = 
VAR vTable = 
    ADDCOLUMNS(
        SUMMARIZE( BOMs, 'Item'[Parent Item], BOMs[Component], BOMs[Qty per piece]
        ),  "@Demand", BOMs[Qty per piece] * [Order Qty]
    )
RETURN

    SUMX( vTable, [@Demand] )

.

Here’s your sample file. Report Boms.pbix (48.7 KB)
I hope this is helpful.

@Yi.Zhang I want to avoid the merger if possible since it is heavy on the resources.

@Melissa, this looks great. I will take a look tomorrow. I’ll let you know if I have any more questions.

Thank you both so much!!!

Nico

1 Like

@Melissa, thanks for showing the tricks of using lookup to relate tables and using summarize to distinct multiple columns. This is really cool.