Complex Scenario Analysis

Dear all,
I am trying to develop some complex scenario analysis using different selections simultaneously.
I would like to see the sales increase simultaneously if we do for instance cumulatively not one after the other:

. increase of X% for customer 1 in country A for product C only in Q4 2020.
PLUS
. increase of Y% for customer 2 in country B for all products in July 2020.

In all the examples I have seen we apply the % sales/cost/demand increase to the same group of products/countries/customers and timeframe. Real life examples are more granular and it is possible in excel.

I have followed all the online courses but I am not sure how to build this up.
Many thanks in advance for your help!!

Hi @Diana1,

Don’t have a ‘perfect fit’ for you but I would look into scenario events to deal with something like that. Key is to include all the attributes/dimensions in the supporting table that you’ll need to consider in your calculations.

I hope this is helpful.

1 Like

@Diana1 ,

In addition to the video that @Melissa posted, you may find this one helpful as well. It’s an approach I’ve found very useful for breaking down complex conditionals like the ones you described above.

  • Brian
1 Like

Hi @Diana1, did the response provided by @BrianJ help you solve your query? If not, how far did you get and what kind of help you need further? If yes, kindly mark as solution the answer that solved your query.

Hi @Diana1, we’ve noticed that no response has been received from you since July 9th. We just want to check if you still need further help with this post? In case there won’t be any activity on it in the next few days, we’ll be tagging this post as Solved.

Dear both,
many thanks for your input, watched the videos you suggested but still not sure how to achieve this in powerBI.
increase of X% for customer 1 in country A for product C only in Q4 2020.
PLUS
. increase of Y% for customer 2 in country B for all products in July 2020.
Scenario Analysis QUESTION2.pbix (992.2 KB)

I tried to do a table with a few combinations customer/product/time/% price increase but do not know how to integrate the selections in the formula with the price increase. (in the typical model we used selectedvalue from the slicer). Maybe you are trying to explain to me that I have to do somethings with variables but I am not that advanced yet. Could you help me further please? :slight_smile: .

Many thank again!!
Diana

@Diana1 ,

I’ve read through your question multiple times and I just can’t wrap my head around exactly what you’re looking for. If you could please provide a mockup of the result(s) you are trying to achieve, that would be a big help.

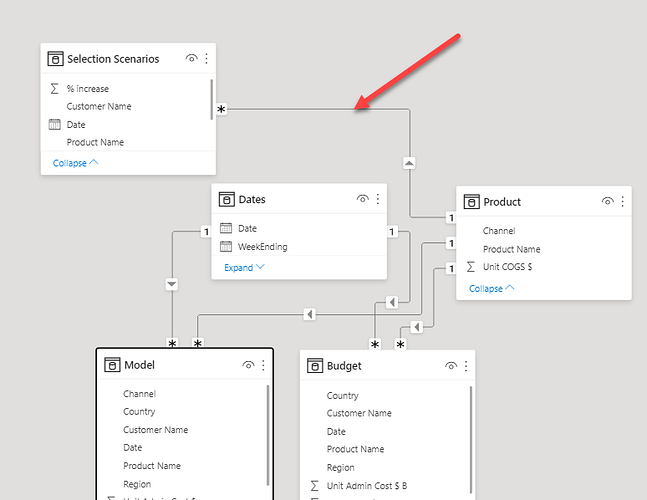
Even without fully understanding the end goal here, I’m pretty certain that this model structure is problematic:

in terms of the marked relationship running in the wrong direction and the scenario selection table not being a proper fact or dimension table. I suspect that if needed at all it should be a disconnected helper table, perhaps feeding what-if parameters or disconnected slicers. Once I get a better handle on the end goal, I’m confident we can help you here.

Thanks!

  • Brian

Hi Brian,
Thanks for your reply :).
What I am after: I would like to see the impact on sales increase simultaneously, and not one after the other as different selections on the slicers, the impacts of granular actions.

I want to see what the impact on sales is at the same time if we do for instance:
. price increase of X% for customer 1 in country A for product C only in Q4 2020.
AND
. price increase of Y% for customer 2 in country B for all products in July 2020.

In all the examples I have seen we apply the % price/cost/demand increase to the same group of products/countries/customers and timeframe.

The last example model I sent was just because I understood this should be done through this sort of table… but this is the problem, not sure how to do it, probably I misunderstood something…

Many thanks again… hope my questions is more clear now…:).
Have a lovely WE.
Diana

Bumping this post for more visibility.

@Diana1 ,

I apologize if I’m being dense here, but it would really help me work out a solution to this if you could mock up an example in Excel. That would help me understand exactly what you want, and also allow me to validate my solution against actual numbers.

Thanks!

  • Brian

Hi @Diana1 , (version 3, with 3 scenarios, with more explanation of points 4 data model connections and 8.1 Treatas formula)

I have made a workout for revenue of your interesting question, with the following concept:

  1. made three scenario data sets, two by copying the base data “Model” and the third made by a calculated table, all with independent flexible filtering possibilities on customers, channel, product, period and country to analyse and create scenarios on those new sets.

  2. add the differences from the three scenario sets, as compared to the base set, back into the base dataset for further analysis and overview.

It is an indirect solution, with the advantages that overview remains and very dynamic scenario analysis is possible. This workout might be an option for different kinds of information, as available in the base data model, like gross margin, there are a lot of combinations possible.

See PBIX :
Scenario Analysis Question v21 plus sc4 calc table.pbix (1.2 MB)

Technical workout of the concept:

  1. Copied the base data set to “Sc1 Base” and “Sc2 Base” with Query Editor, and create a calculated table (see “Additional Info” below for further detailed description)
  2. Added an index to all 4 data sets, to be used as an unique key (The key “Index” is the lowest possible granularity, all granularity levels will be reported)
  3. Copied or created new Lookup tables Dates, Product, Customer for copied new data sets (6 in total), just to be able to sort values of dimensions, (by Sort by Columns e.g. MonthInCalender by MonthnYear), no new lookup tables are created for the calculated table.
  4. Connected in the Data Model the lookup tables to the two copied Scenario data sets, (not tested if separate lookup tables for calculated table also works)
    DISCONNECTED ALL OTHER automatic newly generated connections in the data model, to avoid data connections of the new data sets with the existing data model. (ambiguity/circular references).
    An very important reason to disconnect the scenarios from the base model in the data model is to avoid synchronization of the filtering of the base model with any of the scenarios.
    If for example Customer 8 is selected in Scenario 1, the base model should remain all customers, and not being filtered. If Scenario 1 were connected in the data model, the filtering would synchronize. Each scenario should be Stand-alone in the data model.
  5. Added four parameters for price and volume mutations for the two scenarios via Modeling–> Parameter
  6. Renamed all the dimensions used in the slicers used in the scenarios (e.g. “1Country”) to show that the slicers are from different dimensions.
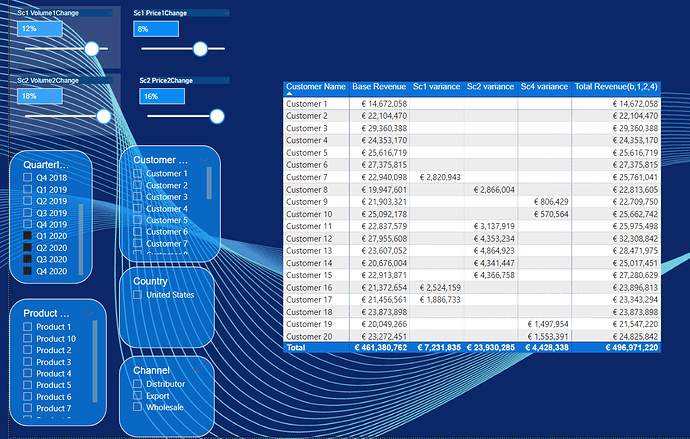
  7. Created are four measure groups, DS Scenario 1, DS Scenario 2, DS Scenario 4 and DS Base Total. The measures in DS Scenario 1, 2 and 4 are: Base revenue, Scenario Revenue (see Add Info) and the difference.
  8. Revenue differences, based upon the scenarios, are reported together with the base model in two steps:
  • 8.1. a Treatas filter for each Scenario, see measure “Sc1 Variance”, filtering the scenario selection (see 8.1 below). Treatas formulas are needed as the scenarios have no connection to the base model in the data model. With no connections in the data model, separate filtering is possible in the base model and in each scenario.

  • 8.2. a Slicer Synchronization for each slicer used (21 in total) at the three Scenario reporting pages (see below 8.2). Without the Slicer synchronization, the Revenue difference for the Scenarios is not taken (it then follows the granularity of the base reporting page)

8-1 Treatas Measure of Scenario 1

Sc1 variance = // SLICER SYNCHRONIZATION REQUIRED FROM SCENARIO 1 PAGE, TO EACH REPORTING PAGE USING THIS MEASURE
         CALCULATE( [Sc1 Diff Rev], 
                 TREATAS(VALUES('Model'[Index]), 'Sc1 Base'[Index]))

8-2 Slicer Synchronization
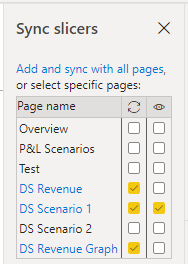
image

Each slicer, used in the two Scenario pages (14 in total), needs to be synchronized with the base reporting pages, to let the Treatas filter measure as stated above, work, see above for one slicer setting (View → Sync Slicers);
Ticking both boxes makes the slicers Synchronized AND Visible :

====================================================================
Additional information:

  • The copying of the base data set can also be done by creating a calculated table(see scenario 4 in attached PBIX), which might be preferable if the base data set only contains a few columns, is not too big and frequently changes.
Sc1 Base = 
     ADDCOLUMNS(
         SUMMARIZE( 'Model',
            'Model'[Index], Dates[MonthInCalendar], 'Model'[Customer Name],'Model'[Country], 'Product'[Product Name], 'Model'[Channel]),
              "Base4Price", [Base avg unit price], "Base4Volume", [Base volume])

Please note that this calculated table should be stand alone in the data model (no data connections), to avoid circular references, and “Index” is added as a unique key to be able to connect this data to the Model data.
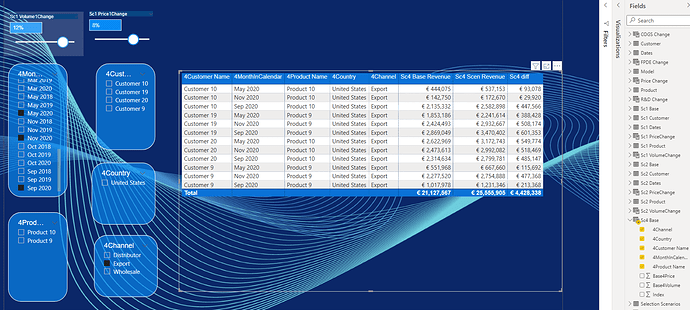
The slicers for this scenario are directly generated from the dimensions generated in the calculated table, like Customer Name, Country, and Channel, see also the Scenario 4 reporting page in the PBIX.
The Volume and Price variation settings are “borrowed” from Scenario 1 for simplicity, possible better to add two new parameters.
(Issue might be that sorting like periods, products etc. is not (easy) possible, as lookup table sorting with calculated tables is not straight forward, it gives e.g. april 2018, april 2019)

  • The scenario revenue is calculated, after the standard filtering on dimensions period, customer, products, country and channel, as follows:
Sc1 Scen Revenue = 
//SLICER VALUES SCENARIO 1
Var Price1Ch = SELECTEDVALUE( 'Sc1 PriceChange'[Sc1 Price1Change],0)  // pricechange scenario 1, default = 0
Var Volume1Ch = SELECTEDVALUE('Sc1 VolumeChange'[Sc1 Volume1Change], 0)  //volumechange scenario 1, default 0
var S1Revenue = SUMX( 'Sc1 Base', ( 'Sc1 Base'[Volume] * (1 + Volume1Ch )) * ('Sc1 Base'[Unit Price $] * (1 + Price1Ch )))  
Return S1Revenue
  • Practice tip creating new slicers, copying from existing slicers: make sure before copying or changing, that the Synchronized Tick box is UNTICKED, to avoid strange slicer reactions from the synchronized (invisible) slicer(s) on the new page or on another reporting page(s).

Kind regards, JW

Reports made in this workout: see also PBIX

Revenue with base model , scenario 1, 2 and 4 example

Scenario 4

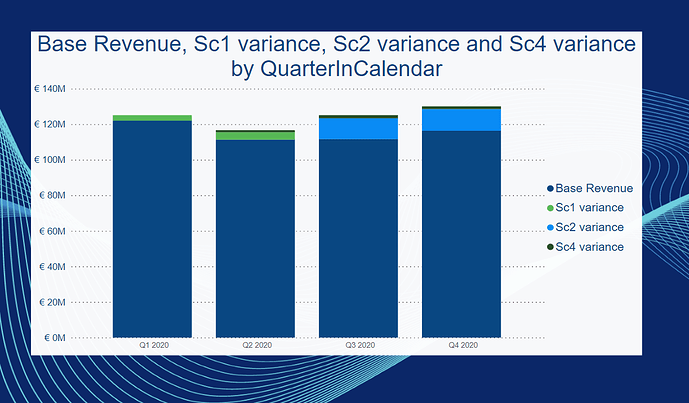
Basic graph of base plus scenarios revenue

5 Likes

@deltaselect ,

WOW!!! This isn’t even a forum solution - more like a whole separate Data Challenge and writeup.

Incredible support. :clap: :clap:

  • Brian
1 Like

Hi @Diana1, did the response provided by the users and experts help you solve your query? If not, how far did you get and what kind of help you need further? If yes, kindly mark as solution the answer that solved your query. Thanks!

Hi @Diana1, we’ve noticed that no response has been received from you since July 17th. We just want to check if you still need further help with this post? In case there won’t be any activity on it in the next few days, we’ll be tagging this post as Solved.

Dear both,
Apologies for my late reply, have been very busy. Please give me some time to review the answer and try to replicate it on my model. I am not that advanced ;). I will come back to you.
Have a lovely WE and thanks for what I see looks like a sophisticated answer with the solution :).
Many thanks,

Sure @Diana1, hope you will be able to give us some feedback soon :slight_smile:

Dear all,
No doubt this is the solution as it does allow the type of calculation I was looking for. Amazing that this can be done in powerBI.
Apologies as I have not grasped 100% of it, I am a beginner, I will have to play around with the model more to assimilate the answer…could any of you kindly explain to me 8.1 please? The concept of treatas values and then calculate filter

@deltaselct, special thanks thanks thanks so much for having taken the time to solve the issue plus writing such a detailed answer!!! I owe you a box of chocolates ;).

@BrianJ , could be great if Sam did a video on this. This is scenario analysis taken to the next level.

Thanks again to all of you!
Have a great day.
Diana

Hi @Diana1 ,

Please have a look at the adjusted text and Treatas formula at 8.1.above. Apparently the second line in the formula is not needed at all, the Treatas formula is shortened, back to the standard.

I also extended the explanation of point 4.

I hope that answers your question. And I am glad I could help you with a Power BI solution.

Kind regards, JW