Complex discount calculation ( time period,customer,products)

CALCULATING THE VOLUME DISCOUNT amount ( giving a certain period , customer AND product)

What’s the problem?
Production is all year but starts increasing rapidly in october year N till march N+1.
This cause a problem in inventory ( where to store the products? ) .
So in order to solve this storage problem customers are encouraged to buy the products in this giving period and store them in their own storage facility.

This comes of course at the price:
A discount rate is offered at the customers but not all customers receive the same discount rate
Restrictions:

• Top customers A B C receive other discount % then customer D to Z
• These % are valid for the sales from 01/09/N till 31/ 03/N+1
• Discount % are valid only for product A and B and C

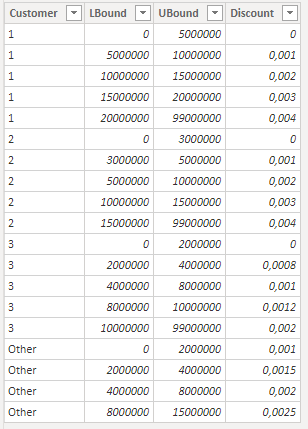
customer A			                                  customer C
cumul turnover				                        cumul turnover		

from to % from to %
0 5.000.000 0,00% 0 3.000.000 0,00%
5.000.000 10.000.000 0.10% 3.000.000 5.000.000 0.10%
10.000.000 15.000.000 0,20% 5.000.000 10.000.000 0.20%
15.000.000 20.000.000 0,30% 10.000.000 15.000.000 0.30%
20.000.000 99.000.000 0,40% 15.000.000 99.000.000 0.40%

customer B			                                  customer D tot Z (rest)
cumul turnover				                      cumul turnover	[discount rate calc.pbix|attachment](upload://fp13PVs2UnfXWLBoVfNeJKo7sYi.pbix) (1.6 MB) ![result discount calc|690x383](upload://guOhZdu9030HKJxorBOzIKyVOea.jpeg) 

from to % from to %
0 2.000.000 0,00% 0 2.000.000 0,10%
2.000.000 4.000.000 0.08% 2.000.000 4.000.000 0.15%
4.000.000 8.000.000 0.10% 4.000.000 8.000.000 0.20%
8.000.000 10.000.000 0.12% 8.000.000 15.000.000 0.25%
10.000.000 99.000.000 0.20%

Having a fact table with all the needed data for two years ( date, customer, sales, product #,…)
What is the best practice to tackle this problem with power BI?
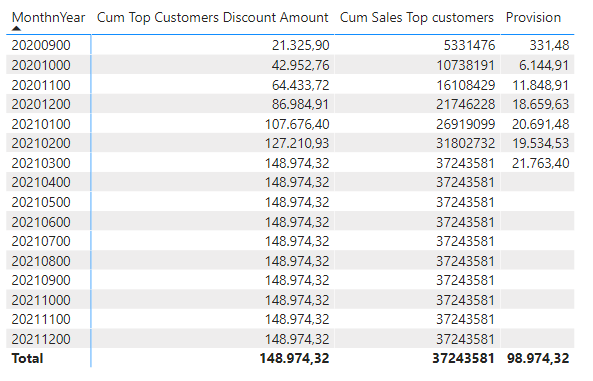
Need a weekly/monthly report to take into account the provision.
I made a power BI file that does the calculation for customer A.
As I just started with power BI this can be improved in many ways?
How can this be made more dynamic when % change and products change

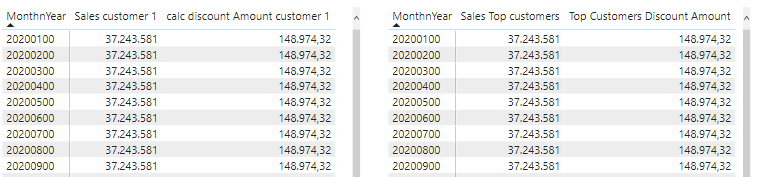
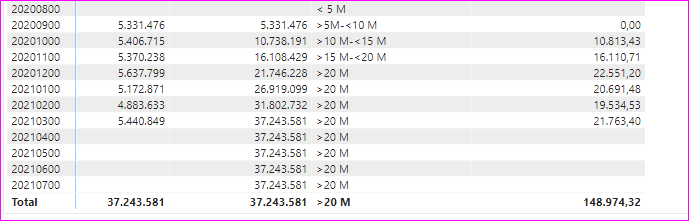
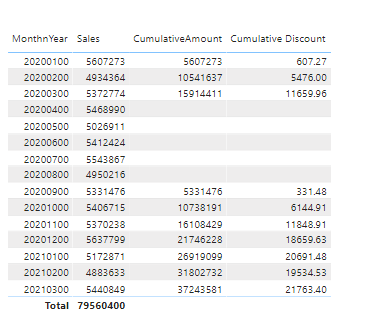
the pic shows how the result should look

for customer 1 if cum sales in the given period is between 2 m and 4 m then sales x %
i succeeded in making a measure but it looks awfull with a lot of constants/text
and want to optimise this measure
any help is greatly apreciated

roger

Hi @Roger, we aim to consistently improve the topics being posted on the forum to help you in getting a strong solution faster. While waiting for a response, here are some tips so you can get the most out of the forum and other Enterprise DNA resources.

  • Use the forum search to discover if your query has been asked before by another member.
  • When posting a topic with formula make sure that it is correctly formatted to preformatted text </>.
    image
  • Use the proper category that best describes your topic
  • Provide as much context to a question as possible.
  • Include the masked demo pbix file, images of the entire scenario you are dealing with, screenshot of the data model, details of how you want to visualize a result, and any other supporting links and details.

I also suggest that you check the forum guideline How To Use The Enterprise DNA Support Forum. Not adhering to it may sometimes cause delay in getting an answer.

Please also check the How To Mask Sensitive Data thread for some tips on how to mask your pbix file.

Hi @Roger, we’ve noticed that no response has been received from you since the 10th of January. We are waiting for the masked demo pbix file, images of the entire scenario you are dealing with, and any other supporting links and details.

This will help other users and experts to answer your inquiry better. In case there won’t be any activity on it in the next few days, we’ll be tagging this post as Solved.

The pbix file and a word doc were joined with the initial question

Hi @Roger. Please upload your supporting documents again for the forum members to pursue (… I don’t see them in your initial post from 2 weeks ago, just in case anyone else is having the same issue).
Greg

attached the files for the calculation

discount rate calc.pbix (1.6 MB) discount problem in PowerBI .docx (18.2 KB)

why is this post withdrawn? posted the PBIX file and the word doc .
I think this is a very interesting topic worth a tutorial !

roger

i deleted my message because i was going to stated that your files wasn’t in the posting but then saw that it was posted

sorry

has anyone looked at my problem ( the PBIX file ) and a word doc explaining the problem?

Hi @Roger,

Welcome to the Forum!

I’ve marked your Calendar table as a Date table (you’ll find that option on the Table Tools ribbon).
As a result all automatic generated hidden date tables get removed and some of your calculations broke because you leveraged that hidden table, easy fix just remove the suffix .[Date] and it’s sorted.

Created a few measures

Sales Top customers = 
CALCULATE( SUM(SALESDATA[sales]),
    FILTER( ALL( SALESDATA ),
        SALESDATA[customer] IN {1, 2, 3} &&
        SALESDATA[product] IN {1, 2, 3}
    ),
    DATESBETWEEN('CALENDAR'[Date], DATE(2020,9,01), DATE(2021,03,31)),
    VALUES( CUSTOMERS[CUSTOMER-id] ),
    VALUES( PRODUCTS[PRODUCT-id] )
)

and

Sales Other customers = 
CALCULATE( SUM(SALESDATA[sales]),
    FILTER( ALL( SALESDATA ),
        NOT( SALESDATA[customer] ) IN {1, 2, 3} &&
        NOT( SALESDATA[product] ) IN {1, 2, 3}
    ),
    DATESBETWEEN('CALENDAR'[Date], DATE(2020,9,01), DATE(2021,03,31)),
    VALUES( CUSTOMERS[CUSTOMER-id] ),
    VALUES( PRODUCTS[PRODUCT-id] )
)

.

Added a Discount table, that is a supporting table so it has no relationships in your model

image

Created another measure

Top Customers Discount Amount = 
VAR myCust = 
    IF( VALUES( CUSTOMERS[CUSTOMER-id] ) IN { 1, 2, 3},
        FORMAT( SELECTEDVALUE( CUSTOMERS[CUSTOMER-id] ), "@"),
        "Other"
    )
RETURN

CALCULATE( MAX( Discount[Discount] ),
    FILTER(
        VALUES( CUSTOMERS[CUSTOMER-id] ),
            COUNTROWS(
                FILTER( Discount,
                    myCust = Discount[Customer] &&
                    [Sales Top customers] >= Discount[LBound] &&
                    [Sales Top customers] < Discount[UBound]
                )
            ) > 0
    )
) * [Sales Top customers]

This matches your expected results

Here’s your sample file.eDNA - discount rate calc.pbix (1.5 MB)
I hope this is helpful.
.

For your reference @Greg did a post on the dynamic segmentation technique, you’ll find that here

2 Likes

Melissa

Many thanks for your reply on my problem !!

You have the same final outcome (after the fiexed time period ) as in my table below, but I need a cumulative discount amount for my monthly provision
End of sept = 0
End of October = 10813.43 = 2%
End of November = 16110.71 = 3%

First I study your measures and view the dynamic grouping patterns

Again thanks a lot
Kind regards

Roger
melissa discount table

Hi @Roger, did the response provided by @Melissa help you solve your query? If not, how far did you get and what kind of help you need further? If yes, kindly mark as solution the answer that solved your query. Thanks!

I replied a couple of days ago ( see me answer above with the screen shot )
the end result was the same but I need the intermediate results month after month
So the topic is not fully resolved

kind regards

Roger

Hi @Roger,

Getting a cumulative value won’t be an issue but as far as I can tell provision wasn’t part of your initial requirement and how these percentages are determined and develop beyond November isn’t clear.

1 Like

Melissa

i uploaded an excel file that calculates the discount amount in detail for customer A
my initial pbix file is not correct because I had no idea how to calculate the surplus when the cumulative sales moves to the next bracket.
If this to difficult I will continue the calculations in excel.
thanks in advance.

Roger
excel for Melissa.xlsx (16.9 KB)

I someone looking at tis interesting problem or are we giving up on this ?

Roger

Hi @Roger

Can you explain What is this “4.668.524” value. As per Excel for Oct Sales is “5406715” and Cummulative Sales is “1,07,38,191.00”, so from where are you getting this.

at the end of  october cumulative sales is in the second bracket 5.000,000 - 10.000.000 discount 0 ,10 % on the sales **4.668.524**  = 4.668,52
and 
moved to the thirth bracket 10.000.000 - 15.000.000  discount 0,20 % on the surplus  sales  738.191 = 1.476,38

Hi @Roger,

Sorry been really busy, see if this does the trick for you

Provision = 
VAR myCust = 
    IF( VALUES( CUSTOMERS[CUSTOMER-id] ) IN { 1, 2, 3},
        FORMAT( SELECTEDVALUE( CUSTOMERS[CUSTOMER-id] ), "@"),
        "Other"
    )
VAR CustTable = VALUES( CUSTOMERS[CUSTOMER-id] )

VAR DiscTable =
    FILTER( Discount,
        Discount[Customer] = FORMAT( myCust, "@" )
    )
VAR PeriodTable =
    CALCULATETABLE(
        VALUES( 'CALENDAR'[MonthnYear] ),
        DATESBETWEEN('CALENDAR'[Date], DATE(2020,9,01), DATE(2021,03,31))
    )
VAR nTable =
    ADDCOLUMNS(
        GENERATE( GENERATEALL( PeriodTable, CustTable ), DiscTable ),
        "@Sales", CALCULATE( SUM(SALESDATA[sales]), SALESDATA[product] IN {1, 2, 3}),
        "@Disc", [Top Customers Discount Amount],
        "@Cum", [Cum Sales Top customers] 
    )
VAR vTable =
    ADDCOLUMNS( nTable,
        "@Remainder", 
            VAR MaXVal =  MAXX( DiscTable, [LBound] ) 
            VAR FirstMax = MINX( FILTER( nTable, [@Cum] > MaXVal ), [MonthnYear] ) 
            VAR CumPrevMonth = MAXX( FILTER( nTable, [MonthnYear] < EARLIER( [MonthnYear] )), [@Cum] ) 
            VAR PrevDisc = MAXX( FILTER( DiscTable, [LBound] < EARLIER( [LBound] )), [Discount] ) RETURN
            IF( [@Cum] > [LBound] && [@Cum] < [UBound] && [MonthnYear] <= FirstMax, 
                (([@Cum] - [LBound]) * [Discount]) +
                IF( NOT( ISBLANK( CumPrevMonth )), (([LBound] - CumPrevMonth) * PrevDisc), 0) , 
                IF( [@Cum] > MaXVal && [LBound] = MaXVal,
                    [@Sales] * [Discount]
                )
            )
    )
RETURN

SUMX( 
    FILTER( vTable, [MonthnYear] IN VALUES( 'CALENDAR'[MonthnYear] )),
    [@Remainder]
)

.

With this result

image

Here’s your sample file: eDNA - discount rate calc.pbix (1.6 MB)
I hope this is helpful

1 Like

Hi @Roger

I have used a slightly different approach. Solution will fulfill only the required request and will need tweaks for any other scenarios. Please find details below.

  1. Created a new Column in Calendar Table. This is to Bound Periods into Sets i.e. from Sep to Mar (Next Year).

DiscountPeriod = if('CALENDAR'[MonthOfYear] in {4,5,6,7,8},BLANK(),if('CALENDAR'[MonthOfYear] in {1,2,3},"DY" & 'CALENDAR'[Year],"DY" & 'CALENDAR'[Year] + 1))

  1. To calculate sales for only specific products and Cumulative value, I have used below measures.

TotalSales_Top3Product = CALCULATE([total Sales],PRODUCTS[PRODUCT-id] in {1,2,3})

> CumulativeAmount =
> IF (ISBLANK ( MAX ( 'CALENDAR'[DiscountPeriod] ) )  || ISBLANK ( [TotalSales_Top3Product] ), BLANK (),
>     CALCULATE ([TotalSales_Top3Product],
>         FILTER (ALL ( 'CALENDAR' ),'CALENDAR'[Date] <= MAX ( 'CALENDAR'[Date] )
>                 && 'CALENDAR'[DiscountPeriod] = MAX ( 'CALENDAR'[DiscountPeriod] ))))
  1. Final Step to calculate Discount
Cumulative Discount = 
var myCust = convert(SELECTEDVALUE( CUSTOMERS[CUSTOMER-id] ),STRING)
Var CummValue = [CumulativeAmount]
Var CummLM = if(isblank(max('CALENDAR'[DiscountPeriod])),BLANK(),CALCULATE([CumulativeAmount],PREVIOUSMONTH('CALENDAR'[Date])))
Var ThisMonthDiscount = FILTER( Discount,Discount[Customer] = myCust && Discount[LBound] < CummValue && Discount[UBound] > CummValue)
Var LMDiscount = FILTER( Discount,Discount[Customer] = myCust && Discount[LBound] < CummLM && Discount[UBound] > CummLM)
Var ThisMonthLB = CALCULATE(max(Discount[LBound]),ThisMonthDiscount)
Var ThisMonthUB = CALCULATE(max(Discount[UBound]),ThisMonthDiscount)
Var ThisMonthDR = CALCULATE(max(Discount[Discount]),ThisMonthDiscount)
Var LastMonthLB = CALCULATE(max(Discount[LBound]),LMDiscount)
Var LastMonthUB = CALCULATE(max(Discount[UBound]),LMDiscount)
Var LastMonthDR = CALCULATE(max(Discount[Discount]),LMDiscount)

return
if(ISBLANK(CummLM),(CummValue - ThisMonthLB) * ThisMonthDR,if(ThisMonthDR = LastMonthDR,[TotalSales_Top3Product] * ThisMonthDR,((CummValue - ThisMonthLB) * ThisMonthDR)  + (ThisMonthLB - CummLM) * LastMonthDR))

Final Output

image

Attached the Solution Ankit - discount rate calc.pbix (1.5 MB)

Few things.

  1. Currently it will work for Single Customer. If required considering all Customer, then will require changes.
  2. In case you want to show Totals also, then there are measures with suffix “Total”.

Thanks
Ankit J

1 Like

Melissa and Ankit

many thanks to Melissa and Ankit for the solution of my discount problem.
I had an Excel solution but the pbix files I received where far more flexible. I wasn’t convinced that it could be solved in power BI but they proved me wrong.
Now I will have to go to all the measures to see how they tackled the problem and learn and absorb

thanks again
Roger

1 Like