Good afternoon and thank you for excellent videos and forum answers that is really helping me build out a complex health care application.
I have seen your video ‘Using Complex Logic Inside Iterating Functions’ but it helps me partially.
I have rules based allocation problem which requires table scan for duplicate values.
I have attached here a detailed example and would appreciate if you can help me.
Thanks for your response and the detail of the business problem is as follows:
Business Issue and Solution Request:
• Business: Managed Health Care Application in USA.
• Data comes in from two distinct sources with their corresponding Health Plan Codes and measures.
Notes on Sources:
Source #1: Health Care Plans (PlanA_Id) and #Lives Covered (PlanA_#Lives) for each of the Plans.
Source #2: Actual #Prescriptions (PlanB_#Prescribe) using Health Care Plans (PlanB_Id)
Source#1 uses Health Care Plan Codes or Ids (PlanA_Id) which are different from Health Care Plan Codes or (PlanB_Id) as used by Source#2.
Business Headache and Issue:
o In reality the Health Care plans are the same but each Source has an unique way and Ids for defining the Health Plans and reporting measures.
Business Ask:
o Need to understand the usage of the Prescription in reference to the #Lives Insured.
o The mapping between PlanA_Id and PlanB_Id is provided and is Many : Many. The underlying data in some cases may need to be adjusted to reflect consumption to demand.
Technology Challenge:
o The sample of the data file (as shown in Excel) worksheet is around 35,000 records.
o The business has determined the rules of adjusting (allocating or %Factor) the Consumption data to reflect Insured Lives.
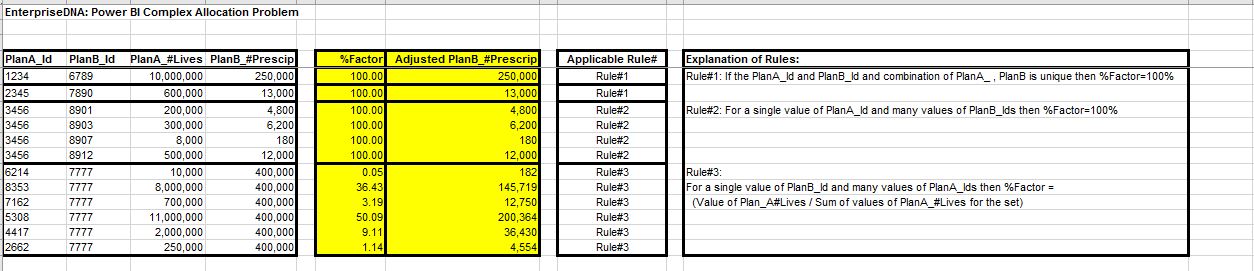
o In case of 1:1 map between PlanA_Id and PlanB_Id no adjustment to #Prescrip is required and hence the %Factor = 100% (Rule#1).
o In case of 1:Many map between PlanA_Id and PlanB_Id also no adjustment to #Prescrip is required and hence the %Factor = 100% (Rule#2).
o In case of Many: 1 map between PlanA_Id and PlanB_Id an adjustment to #Prescrip is required and hence %Factor is calculated.
%Factor calculation: For each value of PlanA_Id divide the #Lives by the SUM of #Lives for all the PlanA_Ids that have the same value of PlanB_Id (Rule#3).
• (In the attached example the PlanB_Id =7777 which has 6 distinct PlanA_Id values associated to it and hence this set falls under Rule#3).
I read through your details a few times and then looked at the spreadsheet but not sure where to start.
This really needs to be in Power BI so like details around the data model, current calculation and context of your calculations for be assessed.
The problem I have with this is that I’m unfamiliar with the data and really don’t see any details in Power BI so it’s very difficult to imagine every variable at play here.
As mentioned I don’t know where to start so will need to see this all laid out in Power BI with a start made.
Are you just looking for this to be in a calculated column?
Or are you looking to represent this another way?
I actually don’t believe it that difficult and writing logic like this rarely is. It’s just understanding fully how are you looking to represent this. This is crucial information.
Hello Sam:
Thanks again for the communications.
I am attaching a .pbix file with data and a reports as to how this would be used.
Basically looking for a calculated column based on the three rules.
What I do not know to do is to how to determine one record and reference with others in the table.
Please let me know if you need further clarifications.
Thanking you in advance. Best regardsBridgePlansForSamEnterprisedna.pbix (512.8 KB)
….Adi
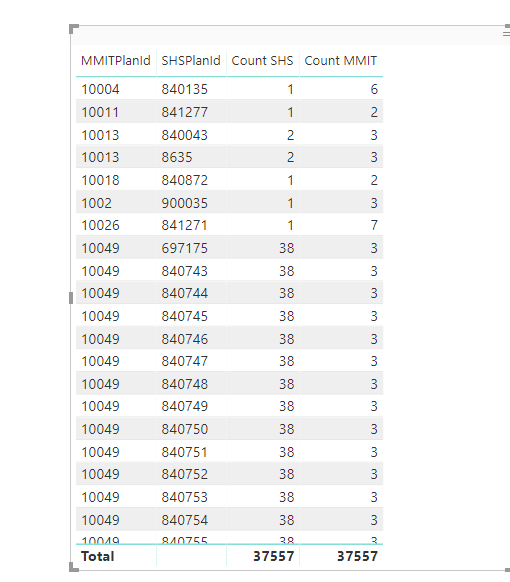
This should help solve for rule 2 & 3 I believe. What I’m ultimately going to try and do it add these to variable within the one formula but it’s always best to break these out first.
This is where I’m at currently.
Having to think about where to next. If any ideas around the data that would be helpful right now.
Hello Sam
Many thanks for the work and indeed this is progress.
Please allow me to review what you sent and will provide some ideas around the data shortly.
Thanks and best regards…Adi