I am trying to build a visual that compares data for the last few forecasts. What I would like to do is to add a column at the end that compares the previous forecast to the current forecast with the change that I could conditionally format.
Tried creating a measure that does this calculation and the filtering on this measure in the visual filters to hide for the other forecasts but this did not hide the columns for B01 (it also puts the change in both the F04 and F06 cols, one is a +ve and one is a -ve). Any ideas on how to do this.
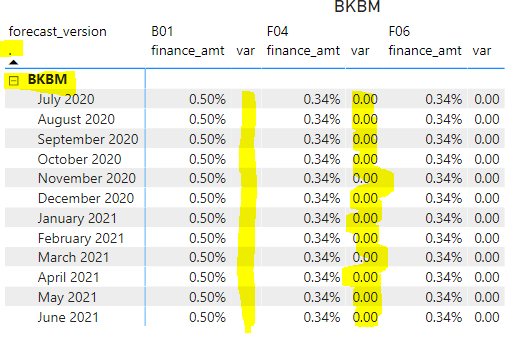
Additionally - Is there anyway to hide the heading on column 1(if i turn off column headings I lose my forecast labels. I tried to add a picture below, trying to remove all of the yellow areas.
Hi @farmboy, we aim to consistently improve the topics being posted on the forum to help you in getting a strong solution faster. While waiting for a response, here are some tips so you can get the most out of the forum and other Enterprise DNA resources.
Use the forum search to discover if your query has been asked before by another member.
When posting a topic with formula make sure that it is correctly formatted to preformatted text </>.
Use the proper category that best describes your topic
Provide as much context to a question as possible.
Include the masked demo pbix file, images of the entire scenario you are dealing with, and any other supporting links and details.
Hi @farmboy, we’ve noticed that no response has been received from you since the 12th of January. We are waiting for the masked demo pbix file, images of the entire scenario you are dealing with, and any other supporting links and details. This will help other users and experts to answer your inquiry better.
In case there won’t be any activity on it in the next few days, we’ll be tagging this post as Solved. If you have a follow question or concern related to this topic, please remove the Solution tag first by clicking the three dots beside Reply and then untick the checkbox. Thanks!