It’s absolutely making sense, Sam but when I used your formulas of 23rd of March in my example-file it seems to be correct. When I put these formulas in data from 2003 until 2018 I’ve got some differences in the calculations.
The calculation
New Customers Total (old) -/- Lost Customers +/+ New Customers Total = New Customers Total (new)
wasn’t correct.
The reason for this was the return of some customers. We’ve counted them as lost but they returned.
Also the following calculation of the Sales was incorrect:
Total Sales (old) -/- Customer Revenue Lost -/- Lost Sales Steady +/+ Won Sales Steady +/+ New Customer Sales = Total Sales (new)
The reason for this was the same, the difference was the sales of the returning customers.
I’m a Finance-man, is it possible to make the numbers correct? Maybe we have to change some formulas of the 23rd of March? Or do I have to accept the differences?
With kind regards,
Cor
This formula here also looks one year forward also to see if customer came back. But it only looks one year forward.
Does this get you what you need?
Customer Lost =
VAR CustomersTY = VALUES( Invoices[Customer] )
VAR CustomerLY = CALCULATETABLE( VALUES( Invoices[Customer] ), SAMEPERIODLASTYEAR( 'Calendar'[Date] ) )
VAR CustomerFuture = CALCULATETABLE( VALUES( Invoices[Customer] ), DATEADD( 'Calendar'[Date], 1, YEAR ) )
RETURN
IF( ISBLANK( [Customer Sales TY] ),
BLANK(),
COUNTROWS( EXCEPT(
EXCEPT( CustomerLY, CustomersTY ),
CustomerFuture ) ) * -1 )
Hi Sam, thanks for you new formula!
Next week I will try this formula with the data from 2003-2018 and I will let you know what the results are.
Have a nice weekend!
Regards,
Cor
Hi Sam, your formula is working on the dummy data but, unfortunately, isn’t the solution for the data from 2003 until 2018. I think that I have to accept the differences. There are too many ways we’ve invoiced our customers and it isn’t possible to make different measures for every exception.
I would like to thank you for the many DAX-lessons and I’m looking forward to speak to you for a next challenge.
With kind regards,
Cor
Ok thanks for letting me know
Hi Sam,
Can you help me with another churn-question…?
Instead of a yearly churn-comparison our company wants a quarterly comparison:
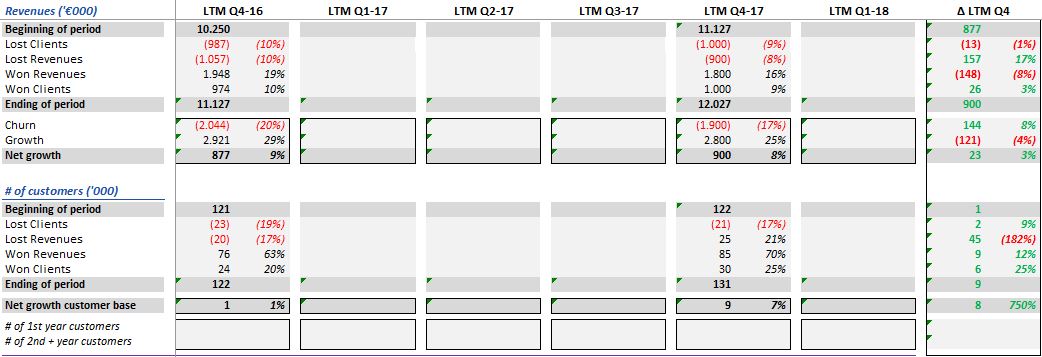
Additional information: this is dummy data en LTM means “Last Twelve Months”.
How do I have to change the formulas for the new - lost and steady customers?
For the totals of the dummy data I have
Total Customers LTM =
CALCULATE(DISTINCTCOUNT(Invoices[Customer]);
DATESBETWEEN('Calendar'[Date];
NEXTDAY(SAMEPERIODLASTYEAR(LASTDATE('Calendar'[Date])));
LASTDATE('Calendar'[Date])))
With kind regards,
Cor
The dummy data I’ve used:
Customer |
Invoice |
Invoice_Date |
Year_Invoice |
Amount_Excl_VAT |
YMD-key |
1 |
1001 |
1-3-2014 |
2014 |
25 |
20140301 |
2 |
1002 |
5-6-2014 |
2014 |
40 |
20140605 |
3 |
1003 |
9-9-2014 |
2014 |
35 |
20140909 |
4 |
1004 |
10-12-2014 |
2014 |
12 |
20141210 |
1 |
1005 |
1-4-2015 |
2015 |
45 |
20150401 |
2 |
1006 |
3-3-2015 |
2015 |
38 |
20150303 |
3 |
1007 |
2-2-2015 |
2015 |
27 |
20150202 |
5 |
1008 |
4-6-2015 |
2015 |
30 |
20150604 |
6 |
1009 |
2-8-2015 |
2015 |
60 |
20150802 |
7 |
1010 |
7-7-2015 |
2015 |
40 |
20150707 |
8 |
1011 |
15-10-2015 |
2015 |
35 |
20151015 |
1 |
1012 |
21-2-2016 |
2016 |
73 |
20160221 |
2 |
1013 |
7-11-2016 |
2016 |
45 |
20161107 |
5 |
1014 |
15-7-2016 |
2016 |
60 |
20160715 |
6 |
1015 |
2-4-2016 |
2016 |
60 |
20160402 |
7 |
1016 |
28-8-2016 |
2016 |
38 |
20160828 |
9 |
1017 |
14-1-2016 |
2016 |
10 |
20160114 |
10 |
1018 |
8-11-2016 |
2016 |
15 |
20161108 |
11 |
1019 |
25-11-2016 |
2016 |
27 |
20161125 |
1 |
1020 |
1-4-2017 |
2017 |
98 |
20170401 |
5 |
1021 |
23-2-2017 |
2017 |
58 |
20170223 |
7 |
1022 |
8-12-2017 |
2017 |
36 |
20171208 |
9 |
1023 |
24-12-2017 |
2017 |
20 |
20171224 |
10 |
1024 |
6-6-2017 |
2017 |
12 |
20170606 |
11 |
1025 |
1-6-2017 |
2017 |
27 |
20170601 |
12 |
1026 |
8-6-2017 |
2017 |
25 |
20170608 |
Hi Cor,
Another tough one here.
Can you add the Power BI model here. Just going to require some testing I think.
I just want to be able to see exactly how this is going to be represented and then run some formula testing through it.
Thanks
bi2-207 churn analysis new-steady-lost customers.pbix (219.3 KB)
Hi Sam,
See attachment for the dummy data.
Chrs,
Cor
Hi Cor, sorry for the delay
Have you by chance reviewed this resource here?
This has basically the formula pattern to use for quarterly churn calculations
Here’s a summary of it
New Customers 90 days =
VAR CustomerTM = VALUES( Sales[Customer ID] )
VAR PriorCustomers = CALCULATETABLE( VALUES( Sales[Customer ID] ),
FILTER( ALL( Dates ),
Dates[Date] > MIN( Dates[Date] ) - 90 &&
Dates[Date] < MIN( Dates[Date] ) ) )
RETURN
COUNTROWS(
EXCEPT( CustomerTM, PriorCustomers ) )
That’s quite a detailed workshop as well
See here for lost customers as well
Lost Customers =
VAR CustomersPurchased = CALCULATETABLE( VALUES( Sales[Customer ID] ),
FILTER( ALL( Dates ),
Dates[Date] > MIN( Dates[Date] ) - 365 &&
Dates[Date] <= MIN( Dates[Date] ) - 90 ) )
VAR PriorCustomers = CALCULATETABLE( VALUES( Sales[Customer ID] ),
FILTER( ALL( Dates ),
Dates[Date] > MAX( Dates[Date] ) - 90 &&
Dates[Date] <= MAX( Dates[Date] ) ) )
RETURN
COUNTROWS( EXCEPT( CustomersPurchased, PriorCustomers ) ) * -1
Understanding CALCULATETABLE is key here
See how you go with these
Hi Sam,
Sorry for the delay, it is holiday-time in The Netherlands and I wasn’t able to access the materials.
I saw both of the videos you’ve mentioned and the techniques are more clear to me than before.
After the holidays I will dive deeper into the quarterly comparisons.
I’ve a question about the new customers and the new customer sales.
The formulas:
New Customers =
VAR CustomerTM = VALUES( Sales[Customer ID] )
VAR PriorCustomers = CALCULATETABLE( VALUES( Sales[Customer ID] );
FILTER( ALL( Dates );
Dates[Date] > MIN( Dates[Date] ) - [Churn Time Frame Value] &&
Dates[Date] < MIN( Dates[Date] ) ) )
RETURN
COUNTROWS(
EXCEPT( CustomerTM; PriorCustomers ) )
New Customer Sales =
VAR CustomerTM = VALUES( Sales[Customer ID] )
VAR PriorCustomers = CALCULATETABLE( VALUES( Sales[Customer ID] );
FILTER( ALL( Dates[Date] );
Dates[Date] > MIN( Dates[Date] ) - [Churn Time Frame Value] &&
Dates[Date] <= MIN( Dates[Date] ) ) )
RETURN
CALCULATE( [Total Sales];
EXCEPT( CustomerTM; PriorCustomers ) )
In the first you’ve used the part “Dates[Date] < MIN( Dates[Date]”, in the second you’ve used the part “Dates[Date] < = MIN( Dates[Date]”, why did you use in the second the extra “=”?
I will talk to you after the holidays,
Chrs,
Cor
I actually think the = is a small oversight. Don’t think you need it here.
Hi Sam,
I’m back from my holiday in Valencia-Spain and I’m struggling again with the formulas so please help me.
I want to compare different periods with each other, see photo below:
How can I put those periods in the different DAX-formulas? I understand the techniques of CALCULATETABLE, EXCEPT, INTERSECT etc. but I have some difficulties to put those periods into CALCULATETABLE.
Thanks in advance,
Cor
Have you got a date table setup?
You will need one for using these formulas and to run this type of analysis.
You can use the date table code within all the course and resources that are made available.
You will just need to make sure your quarters column aligns with the correct dates, then you can just use these formula as is.
Let me know.
Sam
Yes, Sam, I have a date table but I am struggling with the formula.
Won Customers LTM =
VAR CustomerLTM = CALCULATE(DISTINCTCOUNT(Invoices[Customer]);
FILTER(ALL(‘Calendar’);
** what do I have to put here?**
VAR PriorCustomers = CALCULATE(DISTINCTCOUNT(Invoices[Customer]);
FILTER(ALL(‘Calendar’ );
** what do I have to put here?
RETURN
COUNTROWS(
EXCEPT(CustomerLTM; PriorCustomers ) )
))
Can you help me?
Thanks in advance,
Cor
For the CustomerLTM seems to me that
DATESBETWEEN (
Calendar[FullDate],
NEXTDAY ( SAMEPERIODLASTYEAR ( LASTDATE ( Calendar[FullDate] ) ) ),
LASTDATE ( Calendar[FullDate] )
)
is the part that I missed but what do I have to use for the PriorCustomers?
I think I’ve found it:
Won Customers LTM =
VAR CustomerLTM = CALCULATETABLE(VALUES(Invoices[Customer]);
DATESBETWEEN ('Calendar'[Date];
NEXTDAY ( SAMEPERIODLASTYEAR ( LASTDATE ( 'Calendar'[Date] ) ) );
LASTDATE ( 'Calendar'[Date] )))
VAR PriorCustomers = CALCULATETABLE(VALUES(Invoices[Customer]);
DATESBETWEEN('Calendar'[Date];
DATEADD(STARTOFQUARTER('Calendar'[Date]);-4;QUARTER);
DATEADD(ENDOFQUARTER('Calendar'[Date]);-1;QUARTER)))
RETURN
COUNTROWS(
EXCEPT(CustomerLTM;PriorCustomers))
Ok yep that’s great. Yes, I think you certainly have the idea now.
Some sort of pattern but just slight adjustment required for the context of the calculation like you have done.
Chrs, Sam
Hi Sam,
180924 YH Churn per month -1 2003-2004.pbix (593.0 KB)
See attachment.
I am looking for a correct formula for Won Clients for 2004-2.
The context is Year-Month and the comparison is the number of customers last 12 months with the number of customers last 12 month for the prior month.
The correct answer for periode 2004-2 is 356 customers and I have made 3 different measures and the results of these 3 measures is 384 customers. I’m doing something wrong but I don’t know what. Maybe is the reason the leapday 29-02? Can you help me with the correct formula?
Another question:
Result 2003-1: the Total Clients Prior Period -1M and Lost Clients LTM give a result. What can I do to get rid of these results?
Chrs, Cor
Check this one out
Won3 Clients LTM =
VAR CustomerLTM = CALCULATETABLE(VALUES('2003-2004 Invoices'[Customer]),
DATESBETWEEN ('Calendar'[Date],
NEXTDAY ( SAMEPERIODLASTYEAR ( LASTDATE ( 'Calendar'[Date] ) ) ),
LASTDATE ( 'Calendar'[Date] )))
VAR PriorCustomers = CALCULATETABLE(VALUES('2003-2004 Invoices'[Customer]),
DATESBETWEEN('Calendar'[Date],
DATEADD(STARTOFMONTH('Calendar'[Date]),-13,MONTH),
LASTDATE( DATEADD('Calendar'[Date],-1,MONTH) )))
RETURN
COUNTROWS(
EXCEPT(CustomerLTM,PriorCustomers))
The original formula wasn’t actually finding the last date in January, it was going to the 29th
I just tested it (and that’s what I’ve circled). So I knew that wasn’t what you wanted.
You’ll see in the below formula I’ve adjusted it a little bit.
I always break things down like this to audit. It’s the best way.
Chrs