Comparing New vs Lost vs Steady Customers over Multiple Years - Customer Churn Examples - Advanced DAX

Hi Sam,

Thanks for your reply. In the meantime I’ve made the DAX-formulas for New and Steady customers:

Can you help me with the formula for Lost customers? Now I have the numbers for New and Steady customers, how can I connect these numbers with the amount of Sales?

Thanks in advance,

Cor

Working on this one

Ok I’ll break this up because there is a lot to it.

First calculate this

Customers with Sales before today = 
VAR EarliestDate = CALCULATE( MIN( Dates[Date] ), ALL( Dates ) )

RETURN
CALCULATE( 
    COUNTROWS( SUMMARIZE( Sales, Customers[Customer Name] ) ),
        DATESBETWEEN( Dates[Date], EarliestDate, MAX( Dates[Date] ) ) )

Then this

Customers w/Sales Last 90 Days = 
CALCULATE( 
    COUNTROWS( SUMMARIZE( Sales, Customers[Customer Name] ) ),
        DATESBETWEEN( Dates[Date], MAX( Dates[Date] ) - 90, MAX( Dates[Date] ) ) )

Then subtract one from the other

Customers Lost = [Customers with Sales before today] - [Customers w/Sales Last 90 Days]

I’ve been testing this and been getting the results based on my model, but calculations are intensive so it take some time to update

1 Like

Thanks Sam, it’s working, see photo. At our office we are working with customers with a annual subscription so I changed the formula to “Customers w/Sales Last 365 days”.

As you can see it is working on a daily basis, when I change the initial filter to years only the Total is correct. I know that years and days are a different granularity. How can I change that table so it will display the years and the lost customers? (2015: 1 ; 2016: 2 ; 2017:2 makes Total 5)?

With kind regards,
Cor

I’m wondering why exactly the same logic doesn’t work.

It seems to work when I change the context to year instead of the date

I’ve reviewed the example you have sent me.

The reason I see that you are receiving zeros is because the answer is zero.

It’s really as simple as that.

Maybe you’ve sent me a file without all the data.

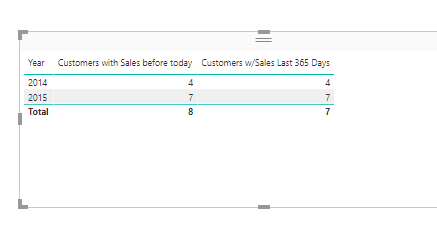
But when I break out the results this is what I get and why it returns zeros for lost customers

image

I don’t understand Sam. Why is the answer zero?

Lost%20Customers2

For 2015 it should be 1, for 2016 the answer should be 2 and for 2017 it should also be 2.

In the following visual the total is 5, but the figures for each year are zero. Why is that?
Lost%20Customers3

The file I’ve sent you has a datatable called “Invoices”, that is the only fact-table.

This is why this is complex.

The totals are relatively meaningless in this case.

It seems that as some customer are lost new ones come in so it’s look like the formula will need to be adjusted.

I will have to review.

After spending a crazy amount of time trying to understand why this wasn’t working it all was because of the relationship!

Because the relationship was based on the keys not the dates, for some reason (can’t tell exactly right now) it wasn’t able to calculate it.

Once I changed this everything worked properly

image

That’s all you have to do in your model

I didn’t think about that Sam, I thought the relationship with the key was correct but I’m glad you’ve found the solution. Thanks for it!

I saw that the number of Customers Lost is a cumulative one, is it possible to get, for example, year 2015: 1, year 2016: 2 and year 2017: 2?

For the amounts I’ve made the following measures:

I’ve made a couple of new measures:
Sales Customers with Sales before today =
VAR EarliestDate = CALCULATE( MIN( ‘Calendar’[Date] ); ALL(‘Calendar’ ) )

RETURN
CALCULATE( 
    [Total Sales];
    ( SUMMARIZE( Invoices; Invoices[Customer] ) );
        DATESBETWEEN( 'Calendar'[Date]; EarliestDate; MAX( 'Calendar'[Date] ) ) )


Sales Customers w/Sales Last 365 Days = 
CALCULATE( 
    [Total Sales];
    ( SUMMARIZE( Invoices; Invoices[Customer] ) );
        DATESBETWEEN( 'Calendar'[Date]; MAX( 'Calendar'[Date] ) - 365; MAX( 'Calendar'[Date] ) ) )

Sales Customers Lost = [Sales Customers with Sales before today] - [Sales Customers w/Sales Last 365 Days]

Result:

Sales Customers with Sales before today: a cumulative one;
Sales Customers w/Sales Last 365 days: seems right, every year has a SUM of the Sales of that year;
Sales Customers Lost: the numbers are not right.

What do I have to do to improve my measures?

Sam, I’ve read the books from Russo/Ferrari, Rob Collie, Avi Singh and Matt Allington but I’ve learned the most from you, many thanks!!!

Regards,

Cor

1 Like

Hi Sam,

In the meantime I’ve made new measures:
Diff. Sales TY vs LY = [Total Sales] - [Total Sales LY]

Sales New Customers = 
VAR
    Customerlist = VALUES(Invoices[Customer])
RETURN
CALCULATE([Total Sales];
    (VALUES('Invoices'[Customer] ) );
    FILTER(
        Customerlist;
        CALCULATE(COUNTROWS(Invoices);
            FILTER(ALLSELECTED('Calendar');'Calendar'[Date] < MIN('Calendar'[Date] ) ) ) = 0) )

Sales Steady Customers = 
[Total Sales] (
    CALCULATETABLE (
        VALUES ( Invoices[Customer] );
        VALUES ( Invoices[Customer] );
        FILTER (
            ALL ( 'Calendar' );
            'Calendar'[Date] < MIN ( 'Calendar'[Date] )
        )
    )
)

The result:

Questions:

  1. The previous report for Customers Lost was a cumulative one, is it possible to have the numbers for each year?
  2. For the steady customers I want to calculate the amount of Lost Revenue - Steady Revenue and Won Revenue. Can you help me with that formula?

Thanks in advance, Sam!

Regards,

Cor

Looking into this now. Just as a side note. Check out this video I made about placing formulas into posts

https://forum.enterprisedna.co/t/how-place-dax-formula-into-forum-topics-posts/156

Ok so I’ve decided to take a different approach here.

I think the past answer was getting an answer that may be relevant but not so in this particular case.

I think what you’re looking for instead is actually checking which customers purchased something in any particular year (not the beginning of the data) and then seeing if they don’t purchase in that next year.

This initial answer was calculating if any customer who had purchased (at any time historically) stop purchasing at any point in time in the future. That’s why it looked like a cumulative total.

image

So to get just the change from one year to the next, this is how I solved it.

It’s actually a relatively clean formula I think.

Customer Lost = 
VAR CustomersTY = VALUES( Invoices[Customer] )
VAR CustomerLY = CALCULATETABLE( VALUES( Invoices[Customer] ), SAMEPERIODLASTYEAR( 'Calendar'[Date] ) )

RETURN
IF( ISBLANK( [Customer Sales TY] ),
    BLANK(),
        COUNTROWS( EXCEPT( CustomerLY, CustomersTY ) ) )

Here are the other formulas

Customer Sales LY = 
COUNTROWS( CALCULATETABLE( VALUES( Invoices[Customer] ), SAMEPERIODLASTYEAR( 'Calendar'[Date] ) ))


Customer Sales TY = 
COUNTROWS( VALUES( Invoices[Customer] ) )

I 'll look at your other ones now

Ok I’ve been playing around with a number of formulas and I think there is much cleaner ways to do this (I’ll have to update some of my own material with these ideas)

See below for some formula that calculate the same thing, but format better.

New Customers Total = 
VAR PriorCustomers = CALCULATETABLE( VALUES( Invoices[Customer] ), 
                        DATESBETWEEN( 'Calendar'[Date], CALCULATE( MIN( 'Calendar'[Date] ), ALL('Calendar' ) ), LASTDATE( 'Calendar'[Date] ) - 365 ))
VAR CustomerTY = VALUES( Invoices[Customer] )

RETURN
COUNTROWS(
    EXCEPT( CustomerTY, PriorCustomers ) )


New Customers Sales = 
VAR PriorCustomers = CALCULATETABLE( VALUES( Invoices[Customer] ), 
                        DATESBETWEEN( 'Calendar'[Date], CALCULATE( MIN( 'Calendar'[Date] ), ALL('Calendar' ) ), LASTDATE( 'Calendar'[Date] ) - 365 ))
VAR CustomerTY = VALUES( Invoices[Customer] )

RETURN
CALCULATE( [Total Sales],
    EXCEPT( CustomerTY, PriorCustomers ) )


Customer Lost = 
VAR CustomersTY = VALUES( Invoices[Customer] )
VAR CustomerLY = CALCULATETABLE( VALUES( Invoices[Customer] ), SAMEPERIODLASTYEAR( 'Calendar'[Date] ) )

RETURN
IF( ISBLANK( [Customer Sales TY] ),
    BLANK(),
        COUNTROWS( EXCEPT( CustomerLY, CustomersTY ) ) )


Customer Revenue Lost = 
VAR CustomersTY = VALUES( Invoices[Customer] )
VAR CustomerLY = CALCULATETABLE( VALUES( Invoices[Customer] ), SAMEPERIODLASTYEAR( 'Calendar'[Date] ) )

RETURN
IF( ISBLANK( [Total Sales] ),
    BLANK(),
        CALCULATE( 
            CALCULATE( [Total Sales], SAMEPERIODLASTYEAR( 'Calendar'[Date] ) ),
                EXCEPT( CustomerLY, CustomersTY ) ))


Customers Steady = 
VAR CustomersTY = VALUES( Invoices[Customer] )
VAR CustomerLY = CALCULATETABLE( VALUES( Invoices[Customer] ), SAMEPERIODLASTYEAR( 'Calendar'[Date] ) )

RETURN
IF( ISBLANK( [Customer Sales TY] ),
    BLANK(),
        COUNTROWS( INTERSECT( CustomerLY, CustomersTY ) ) )


Customers Sales Steady = 
VAR CustomersTY = VALUES( Invoices[Customer] )
VAR CustomerLY = CALCULATETABLE( VALUES( Invoices[Customer] ), SAMEPERIODLASTYEAR( 'Calendar'[Date] ) )

RETURN
CALCULATE( [Total Sales],
    INTERSECT( CustomerLY, CustomersTY ) )

Give these all a go.

These are crazy formulas! They are so powerful in there simplicity for something quite complex

And I have to go and update all my own materials!

Thanks
Sam

Thanks Sam, great work, I am very happy with all your formulas and I understand the techniques. :grin:

I’ve made a little change for the “lost” formulas:

Customer Lost = 
VAR CustomersTY = VALUES( Invoices[Customer] )
VAR CustomerLY = CALCULATETABLE( VALUES( Invoices[Customer] ); SAMEPERIODLASTYEAR( 'Calendar'[Date] ) )

RETURN
IF( ISBLANK( [Customer Sales TY] );
    BLANK();
        COUNTROWS( EXCEPT( CustomerLY; CustomersTY ) ) *-1 )

Customer Revenue Lost =
VAR CustomersTY = VALUES( Invoices[Customer] )
VAR CustomerLY = CALCULATETABLE( VALUES( Invoices[Customer] ); SAMEPERIODLASTYEAR( ‘Calendar’[Date] ) )

RETURN
IF( ISBLANK( [Total Sales] );
BLANK();
CALCULATE(
CALCULATE( -[Total Sales]; SAMEPERIODLASTYEAR( ‘Calendar’[Date] ) );
EXCEPT( CustomerLY; CustomersTY ) ))

As you can see the “lost”-figures are now negative.

At this point we’ve almost have every figure but I only need to divide the steady customers in the segments Lost - Steady and Won:

Can you help me with these formulas?

Thanks in advance,

Regards,

Cor

I struggling to really understand what you need based on the image.

Can you give me more color around the logic and lay it out for me.

Okay Sam, let’s clear this up.

See photo below for the starting point.
I’ve used your formulas for this, I’ve made only a little change for “Customer Lost” and for “Customer Revenue Lost”, both are negative now:

At this point I want us to concentrate on the “Customers Steady”.
I want to divide the steady customers in the following segments:

Lost Revenue – Steady Revenue – Won Revenue

2015:
There are 3 Customers Steady (customer 1, 2 and 3).
Customer 1: Revenue 2015 -/- Revenue 2014 = 45 -/- 25 = 20 = Won Revenue
Customer 2: Revenue 2015 -/- Revenue 2014 = 38 -/- 40 = - 2 = Lost Revenue
Customer 3: Revenue 2015 -/- Revenue 2014 = 27 -/- 35 = - 8 = Lost Revenue

180322-2

Check number of Customers:
There were 4 customers at the end of 2014. We lost in 2015 1 customer and we won 4 customers.
At the end of 2015 we have 7 customers (4 -/- 1 +/+ 4). The report gives the right number.

Check amount of Revenue:
The revenue for 2014 was 112, the revenue for 2015 was 275. The positive difference is 163, what’s happened in 2015?

Customer Revenue Lost:
We lost customer 4 in 2016, revenue lost is -12;

Steady customers:
Lost Revenue steady customers = -10 (customers 2 and 3)
Won Revenue steady customers = 20 (customer 1)

New Customers Sales:
The new customers in 2015 were customers 5, 6, 7 and 8, won revenue: 165

Check the amount:
112 -/- 12 -/- 10 +/+ 20 +/+ 165 = 275, the Total Sales in the report is giving the right amount.

I hope you understand now what I want, if not, then I have to look for another way to explain it to you.

Hopefully you can help me with the formulas for the customers steady.

Thanks in advance,

Regards,

Cor

Ok thanks for the detail on this. Give me a little bit to work through it, as it’s complex.(but I like the challenge)

Thanks

I’m probably going to have to pick this up next week sorry. Very very complex, need time to sit down and work through this (just have other pressing things right now). Could take me a few hours, just can’t commit to this at this second.

Thanks
Sam

Couldn’t get this off my mind. So have been working on it.

Think I might have it actually.

image

Which comes from these two tables, and the logic works out from my calcs

image

Here are the formula

Won Sales Steady = 
VAR CustomersTY = VALUES( Invoices[Customer] )
VAR CustomerLY = CALCULATETABLE( VALUES( Invoices[Customer] ), SAMEPERIODLASTYEAR( 'Calendar'[Date] ) )

RETURN
CALCULATE( [Sales Diff.],
    FILTER( INTERSECT( CustomerLY, CustomersTY ),
        [Sales Diff.] > 0 ) )


Lost Sales Steady = 
VAR CustomersTY = VALUES( Invoices[Customer] )
VAR CustomerLY = CALCULATETABLE( VALUES( Invoices[Customer] ), SAMEPERIODLASTYEAR( 'Calendar'[Date] ) )

RETURN
CALCULATE( [Sales Diff.],
    FILTER( INTERSECT( CustomerLY, CustomersTY ),
        [Sales Diff.] < 0 ) )


Same Sales Steady = 
VAR CustomersTY = VALUES( Invoices[Customer] )
VAR CustomerLY = CALCULATETABLE( VALUES( Invoices[Customer] ), SAMEPERIODLASTYEAR( 'Calendar'[Date] ) )

RETURN
CALCULATE( [Sales Diff.],
    FILTER( INTERSECT( CustomerLY, CustomersTY ),
        [Sales Diff.] = 0 ) )

I went through your list. Does this cover off everything now?