Comparing events with non-standard dates (paychecks)

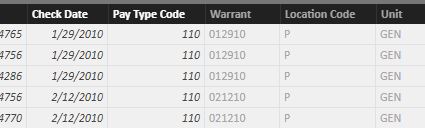
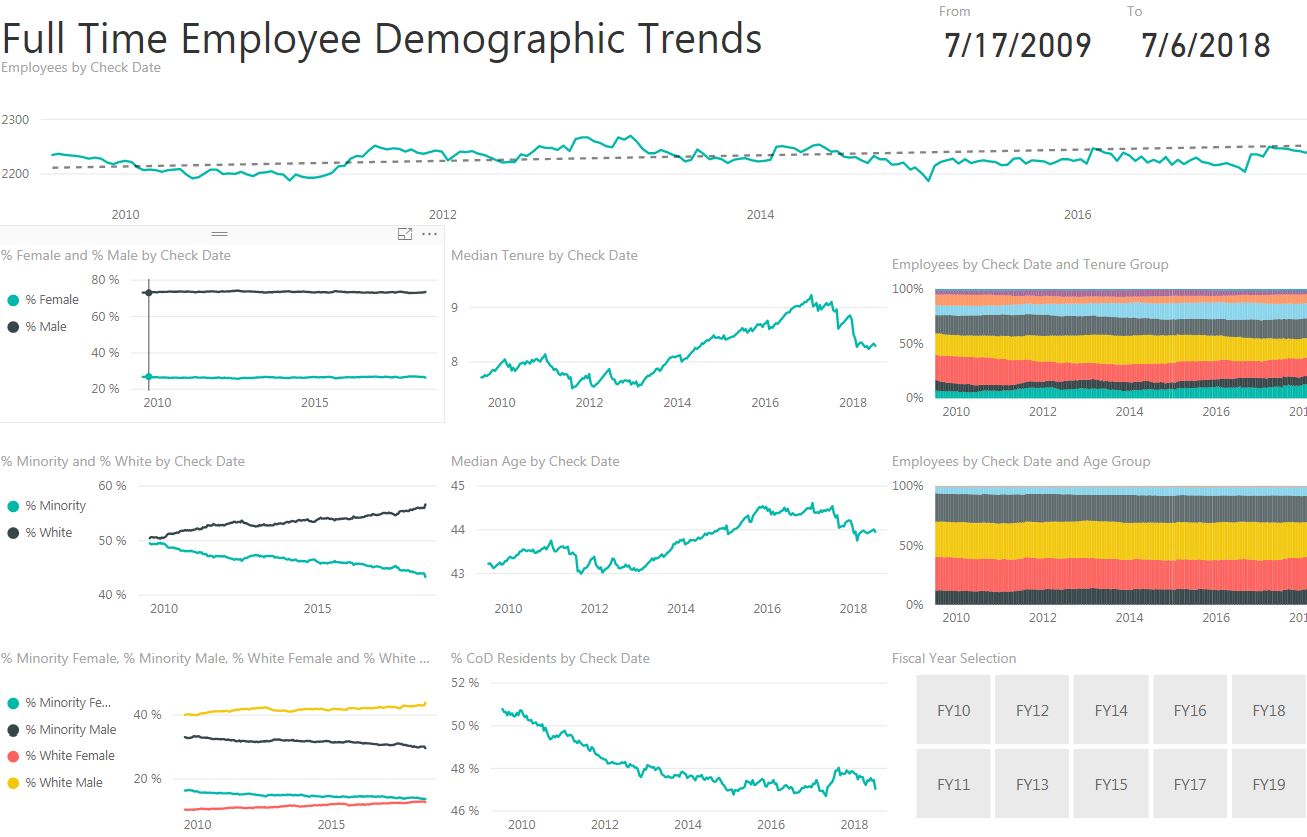
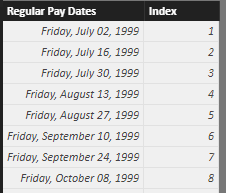
Hello, I have a fact table that includes 10 years of paychecks. I am using it to calculate the number of employees active on each pay date. Employees are paid every two weeks, but the exact date varies due to holidays. I have a related lookup table that has all of the pay dates I am including in the dashboard (used for filtering out non-standard pays) which also includes an index column (so that more recent paychecks have a higher number).

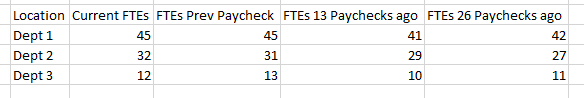
I’d like to create measures that compare the current number of employees vs. the number from 1, 6, and 26 paychecks ago. In plain English, I feel like I should be able to say, “Employees on Previous Paycheck = get the index number of the most recent paycheck, subtract 1, and return the number of employees for the paycheck with that index number.” And then create additional measures subtracting 6, 26, or whatever.

Any help would be much appreciated, I’m sorry if this has been answered in a previous post – I’m new enough that I still have trouble cross-referencing answers that aren’t in the exact terms I’m looking for.

Thanks!

Going to have to see the model and then a table that has how you want to show the results. Eg. The context you want to show these results in.

The more images showcase each part of this scenario the better.

Thanks

The best thing to do here is to set everything up in your report and then create a table with the context you want to show the results. Then it will be much easier to assess what you need.

If you’ve started working on a formula as well then add that also.

Thank you Sam, here’s what I’ve got so far.

The model looks like this:

The “Unique FTE Pays” table brings in one pay record for each employee for each check date (I did a bunch of filtering in the query editor to make this happen). The first column is a unique employee ID; I cut it off for privacy:
pays

I’ve created a bunch of measures, pretty much all variations on this employee count measure: Employees = COUNT(‘Unique FTE Pays’[EID])
This returns the number of employees, which i then slice by all those lookup tables and a few calculated columns to generate a dashboard like this:

What I’m interested in with this whole report is how our demographics have changed over time. What I’d like to do is go one level deeper, and show how the demographics have changed by work location (“Locations” table in the model) over a specific number of paychecks. So, the first table i’d make would be something like this:
image

Again, I have this “Regular Pay Dates” table that I use to filter out non-standard pays that only a few employees might get, since I"m only interested in regular, full-time employees who are active during each pay period. I put an index in there, thinking I could do some sort of math as described in my first post, in plain english – “Employees on Previous Paycheck = get the index number of the most recent paycheck, subtract 1, and return the number of employees for the paycheck with that index number.” The table is very simple and looks like this:
image

I already have calculated columns in my fact table to identify the max date (most recent paycheck) and then denote the latest check as follows:

MaxDate = CALCULATE(MAX('Unique FTE Pays'[Check Date]),FILTER('Unique FTE Pays',EARLIER('Unique FTE Pays'[Check Date])))

Latest Check = IF('Unique FTE Pays'[Check Date]='Unique FTE Pays'[MaxDate], "Y", "N")

I’ve pieced this all together and it works as is, but can’t quite make the leap to the next level down. I really appreciate all the resources you’ve put together here, and how quick you are to respond. Please let me know if I can provide additional information; for privacy purposes I can’t share my data in full.

Ok thanks for all the info.

I think this is what you have to do here.

You need to have a lookup table the has all the pay dates (maybe you already have this ) - looks like you do.

Then you need to link this to your fact table (index to index if possible )

At this point the best thing to do it lay all this out in a table on a separate page. I always use tables to understand the behaviour of calculations one step at a time.

The reason this is so important is you need to see the context of the calculation very clearly. It makes understanding what’s going on that much easier.

The first calculation you would need I’m guessing is the most recent payout.

Then you would want a calculation that works out how many pay dates back from the most recent one.

You want to do all of this with measure though. Because if you do it in calculated column it won’t be dynamic and won’t adjust for changes to the date range you may have in your report.

There’s actually a few steps here. We’ll have to work through one by one I think.

First let’s set up a table that has every paydate, then a calculation which shows which how far back for the most recent pay date every pay date it.

Then is should be relatively straight forward from there, because you can use DISTINCTCOUNT( Employees ID) to work out the number of employees.

After this we have to work with a supporting table, but let’s get this right first

I figured this out and wanted to share. I don’t know if it’s the most elegant, but it works, so good enough for now :grin:

I did end up using a RANK(X) formula in my fact table as below:

Check Rank = RANKX(
    FILTER('Unique FTE Pays',
        'Unique FTE Pays'[Regular Paycheck]="Y"),
        'Unique FTE Pays'[Check Date],,DESC, Dense)

This formula sets it up so that all the regular paycheck dates are ranked from newest to oldest.

I can then use this measure to find the number of employees (FTEs) on the most recent check:

FTEs Current = CALCULATE([Employees], FILTER('Unique FTE Pays','Unique FTE Pays'[Check Rank] = 1))

Then I did a series of measures calculating the number of employees for different numbers of checks ago (26 pay periods per year, so one paycheck every two weeks):

Employees 12 Wks Ago = CALCULATE([Employees], FILTER('Unique FTE Pays','Unique FTE Pays'[Check Rank] = 7))

Then it was simple math to figure out the numerical difference between the current number of FTEs and any of the other time periods:

FTE Change 12 Wks Ago = [FTEs Current] - [Employees 12 Wks Ago]

And then of course I can do % change as well:

FTE % Change 1 Yr Ago = DIVIDE([FTE Change 1 Yr Ago], [Employees 1 Yr Ago])

So, i got what I needed. Hope that’s useful to someone else. And if you have any ideas, let me know!

Nice one. Looks great. Glad that you got there. There was certainly a bit to this one to get it all right