I am trying to compare Estimated vs Projected cost over multiple years on active and inactive projects. A project can be inactive one year and active the next (e.g. active in 2017, inactive in 2018 and active in 2019). I am running into an issue when a project goes from active, to inactive and back to active over time. If this situation happens, I need to pull forward the estimated vs projected costs LY into the latest estimated vs projected cost to properly calculate the most recent comparison of estimated vs projected cost. The first three in the snip it are calculating correctly, but the last two are incorrect. Can someone please take a look?
Job Cost Margin Analysis v2.pbix (778.5 KB)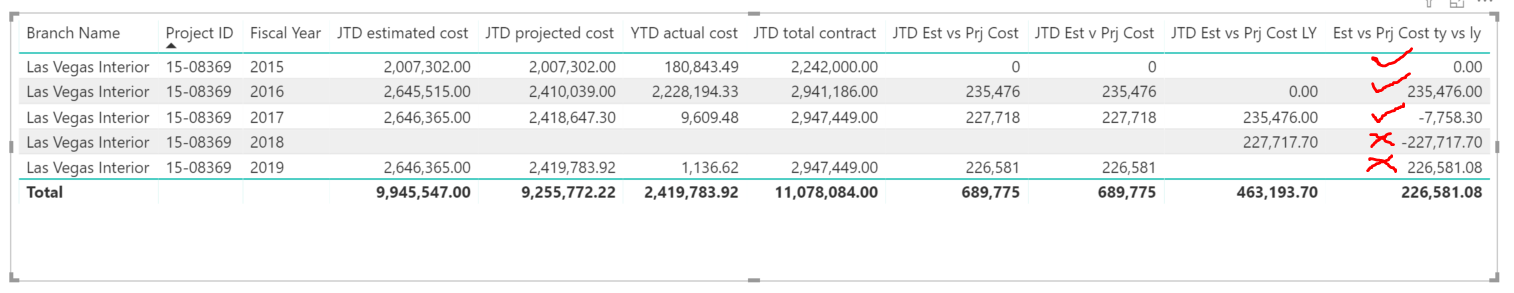
I just realized the issue is actually with the JTD est vs Prj cost formula, not the LY formula. Either the JTD est vs prj cost needs to pull forward, or the LY formula should not be calculated if the JTD est vs Prj cost is blank. I have tried a number of different solutions but haven’t been able to get it figured out.
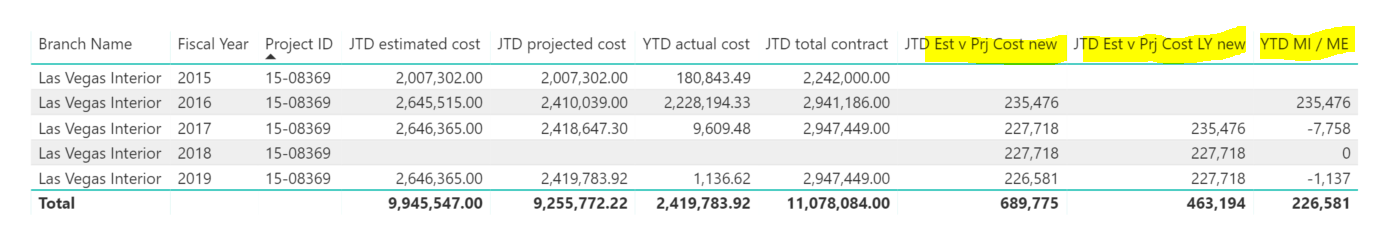


The issue I’m running into now is the totals aren’t calculating correctly. It has something to do with the $0 values in the YTD MI / ME column. When I filter out the zeros in the table, it appears to sum correctly. Any ideas on how to fix? New PBIX file loadedJob Cost Margin Analysis v2.pbix (779.4 KB)
Like your model, nice work
For the totals you need to use a branch of SUMX rather than the IF statement you currently have.
It’s all to do with the context of the total versus every row.
See below for exact examples of the technique to use here.
Thanks
Sam
Hey Sam - Thanks for reaching out and thanks on the compliments. I’ve been progressing nicely thanks to EnterpriseDNA. Still a long way to go!
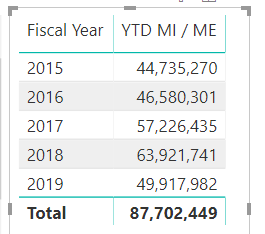
I forgot to send an update to the message before you responded. I ended up tracking down those viedos within the Advanced DAX combinations module and getting it (partially) resolved. I utilized the sumx and was able to get the tables summing correctly with exception of when there is no filter specified for fiscal year.
As you can see the sum of these values is not 87.7MM, rather a number much higher.
This is the measure I used to get the YTD MI / ME total correct when a fiscal year slicer was selected.
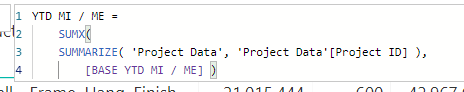
I guess now that I think about it, maybe if I apply the logic from the YTD MI / ME to the base measures, it will resolve it… Thoughts? New PBIX Job Cost Margin Analysis v2.pbix (871.3 KB) file attached. Thanks again for your help.
I think this resolved it.
Thanks,
Nick
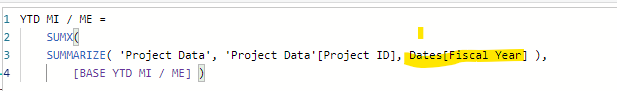
Yes that’s correct I didn’t see that in the initial formula which is a must, having the year column in there
Sam
1 Like
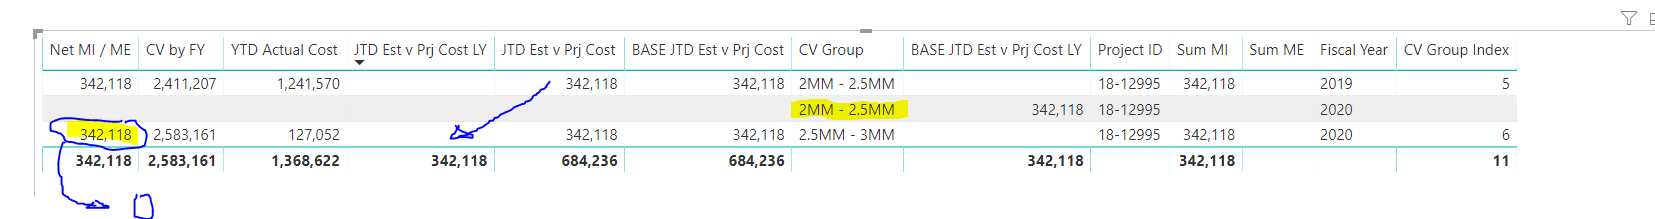
So I have run into another snag on pulling forward a value from prior year when the CV group changes. In the snip it below, the CV group changes from 2-2.5MM to 2.5-3MM and it’s not pulling in the JTD Est v Prj cost from the prior year. It is causing Net MI / ME to incorrectly calc in the new year. I somehow need to get it to ignore the middle line in the table and pull the 342,118 into JTD est v prj cost LY line. Been looking through videos and haven’t found anything that addresses it directly. Thanks for your help in advance!

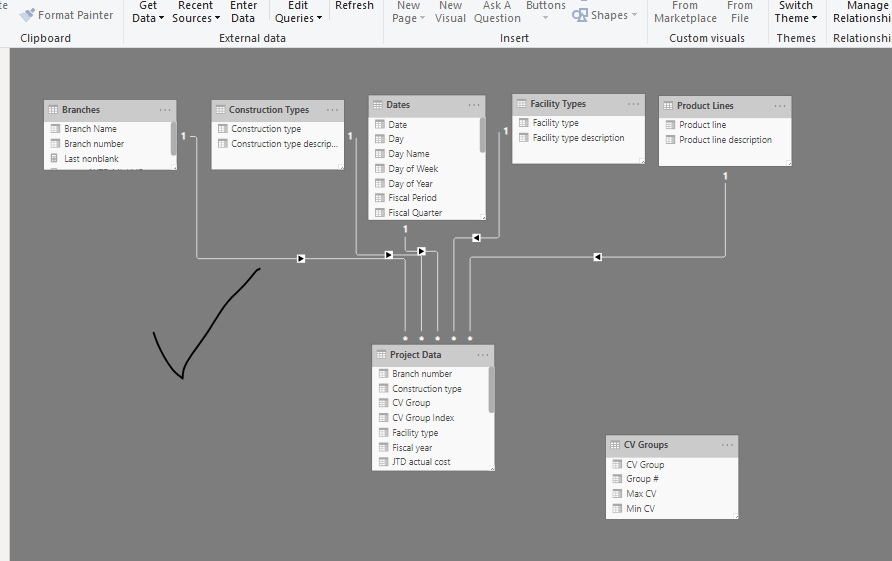
This will all be to do with the model and the filtering occurring via you relationships.
The column that was removed likely isn’t setup to directly filter the formula you have created. I would review in depth that it all makes sense in your model.
Sam
Thanks Sam. I will dig in an see if I can come up with something. Basically, what I did on the CV group was use your grouping tool to hard code a calculated column for CV group into the fact table. So the CV group attributes are pulled directly from fact table as I did not create a dynamic formula that directly applies to the group table. I will start there. Thanks again for the help.