I have a revenue file that I call baseline, and I want to compare our revenue file as of today and identify all changes.
All columns are the same in both tables, and there is a unique id which can be used to compare rows between both tables.
I’m looking for guidance on the best way to start this model. Do I maintain two separate tables, or do I add a column to Baseline called Baseline and a column to current file call current and then append the table into one, or do you recommend something else.
Each tables have about 30 columns, and I’m mainly looking to compare about 10 of these columns, identifying changes, in values, dates etc…
I’m sure someone must have done this before, and I’m just looking for the best way to start this.
I encountered a very similar situation recently, where I had two tables structured very similarly – one for obligations, and one for expenditures. In general, I think DAX and Power BI do best with a “narrow and long” (i.e., fewer columns, more rows) data structure. I ended up appending the two tables together, just with a “Transaction Type” field to distinguish between obligations and expenditures, and it’s worked out beautifully. Simplified the data model, measures are easy to write and understand, etc. That’s definitely the path I would recommend.
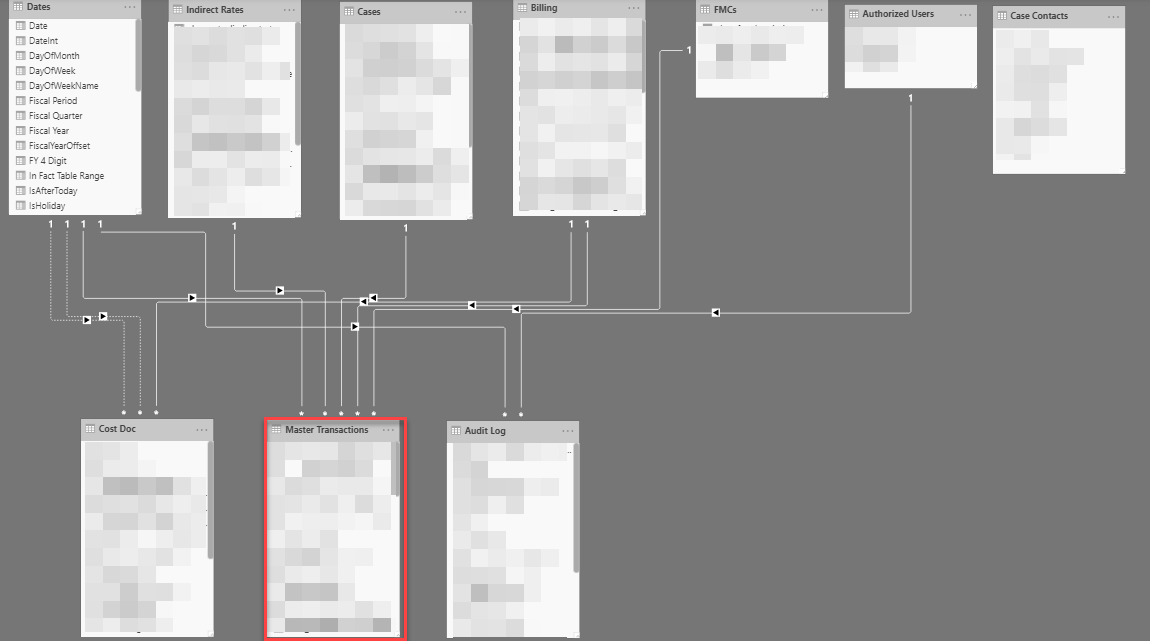
Unfortunately, this pertains to a large financial project used to manage recoveries from litigation/settlements, so I’m limited in what I can share. However, here’s the overall data model:
The analytical powerhouse of the structure is the Master Transactions table which integrates data from a number of different authoritative financial sources. In addition to the key fields linking each transaction back to the relevant dimension table, and a series of fields tracking the status of workflow approvals for transactions, we’ve employed a “long and narrow” approach, the core of which is the following fields for each record:
Transaction ID
Transaction Date
Transaction Type
Amount
where Transaction Type encompasses Receipts, Obligations, Allocations, Expenditures, Deobligations, Manual Adjustments, Transfers In and Transfers Out.
This dovetails beautifully with the CALCULATE/FILTER paradigm in DAX, where we perform operations on Amount, filtered by Transaction Type. Then linking the Transaction Date to @Melissa’s Extended Date Table gives us the ability to do a full range of time intelligence analysis.
Hope this is helpful. Would be glad to take a look at your current data model/fact table structure.
Given that, maybe you just declare victory and call it a day.
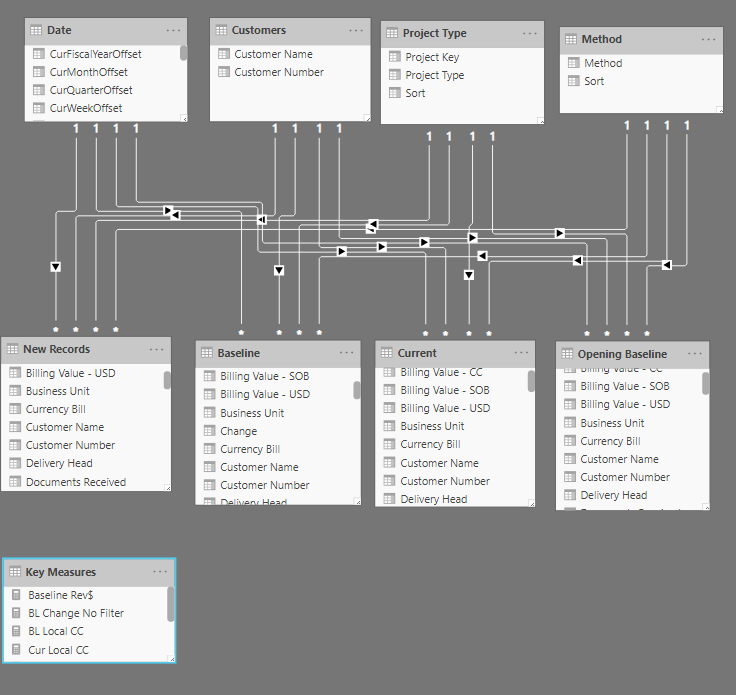
But it does seem that your situation is very analogous to mine above, and at least on the face of it you could create a field called something like “Record Type” in each table, and then via append, collapse them into one consolidated fact table, where Record Type = New Record, Baseline, Current or Opening Baseline – which would clear out 3/4 of the spaghetti in the middle, with no loss in analytical capability…