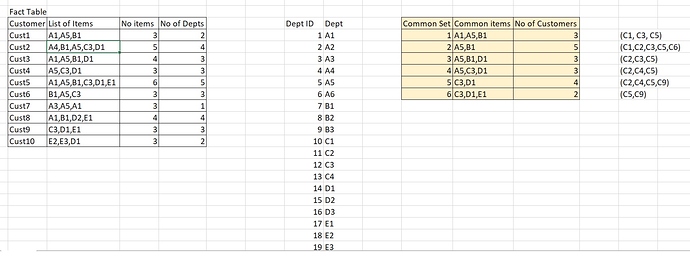
How to find commonly purchased items from sales table, so that we increase the sale if any of the commonset if items are purchased and recommend the other sets along with it. Similar to market basket.
example
I have a Sales table, with list of Geography wise, Customers, Dept, Items sold with Sales total for each item etc.
If we need to find common items purchased by 2 or more dept areas and more than 2 Customers etc. This will help to sell more on those items as well stock them adequately.
North America (Geo), Stationary, tools, Furniture (departments), common items purchased are Note books, wooden table, Hammer - by 40 customers and the combinations of items can be 10 + and its total Customers count and Sale value.
Something like Apriori or FPgrowth algorithm type of solutions.
Please let me know, if we can do this using Power BI.
Thanks
Swami
Have a look through this video and resource download and see if these get you what you need.
I will say though that this analysis in Power BI is about as complex as it gets, so there’s quite a lot to learn about DAX especially to really understand what is happening here.
1 Like
Thanks Sam. I watched this video and that’s when I joined as a member. But I need something more than this.
Please find my sample data and the expected output from common set of items purchased.
Please let me know, if you can help me on this.
Can you breakdown and describe the logic for me.
I’m finding it difficult to understand it, just by looking at these numbers.
Also do you have an image of your current model. This will be very important for this
Thanks
Hello Sam,
Please find the expected output.
I have Dept Table, Item table, Sales table, Geography table, Customer table. To start with I need to find the max number of items purchased with 2 or more Customers and with 2 or more Departments.
Example - A004, A006, A009, B017, B024, D001 is the list of items purchased by 6 customers and its the starting set of items. You can see this in last but 1 row in the picture.
Now we need to find the what other combinations of these 6 items where sold for how many customer is what is displayed (the output).
The most number of customers - 3 items where sold the most (1st row) - A006, B017, D001 - for 14 customers. The Items count is 3 and number of Dept is also 3 in this set.
So I have found that these are the others 21 combinations we can have with the above mentioned items set (A004, A006, A009, B017, B024, D001).
Your cross sell opportunities is more of in Pair. Here we need set of items and their various combinations and output. Apriori algorithm or FPgrowth Algorithm explains the same.
Hope I could explain it.
Thanks
Swami
Ok this is very complex, and not something I have create many demos on myself.
My feeling is this can be done (anything can be done in Power BI) but it’s just very difficult and will need a lot of checking etc.
I really like the concept, and will work to find a solution, but will need some time.
I will come back when I have some meaningful formulas and ideas for you.
Sam
Thanks Sam.
That’s right it is complex, taking a set of items and then finding all combinations of those items in group and finding the number of customers is what I am looking for.
This will help many of the Analytics users especially the Sales offering team etc.
The apriori algorithm is doing it, just to understand the logic behind it.
Thanks for taking this up.
Regards
Swami
Hello Sam,
Could you please let me know, if you had a chance to work on this.
Thanks
Swami
Unfortunately no, I haven’t been able to find a solution.
Sorry just can’t promise anything at this stage as is a significant undertaking and have to prioritize other updates for now.
Chrs
Sam
