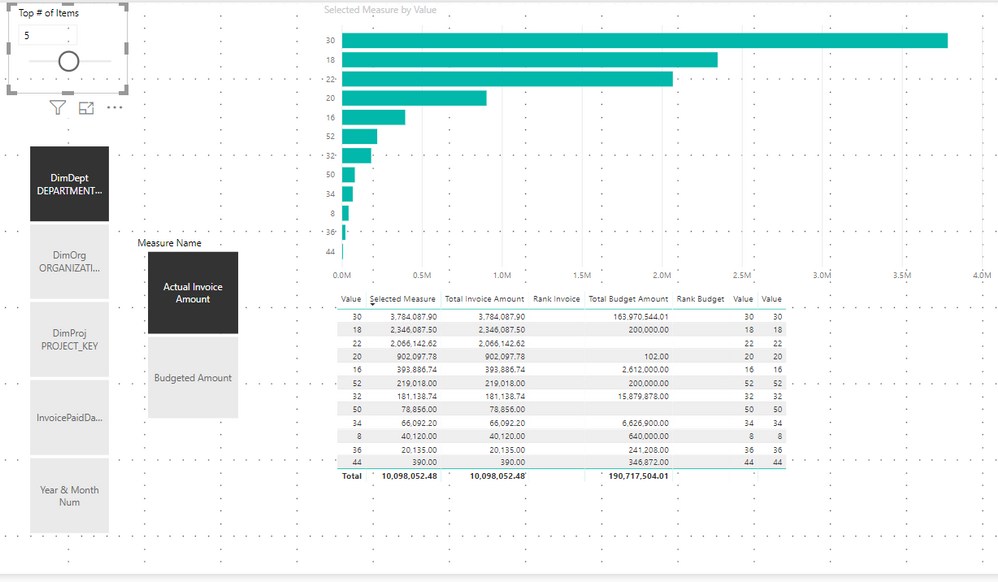
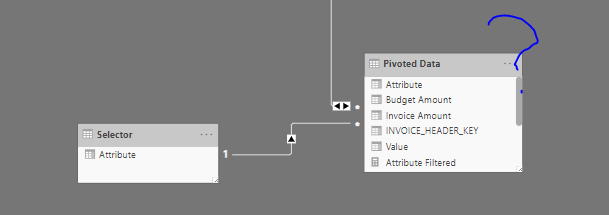
I found that most tutorials recommended putting that Selector table to select Attributes. It didn’t work for me really, so I used the Pivoted Data[Attribute] instead for the Dynamic Attribute Slicer. How can we get the Top # of Items table connected to the Dynamic Attribute filter and the Dynamic Measure filter so that end users can filter out the TopN values. Example workbook is attached.
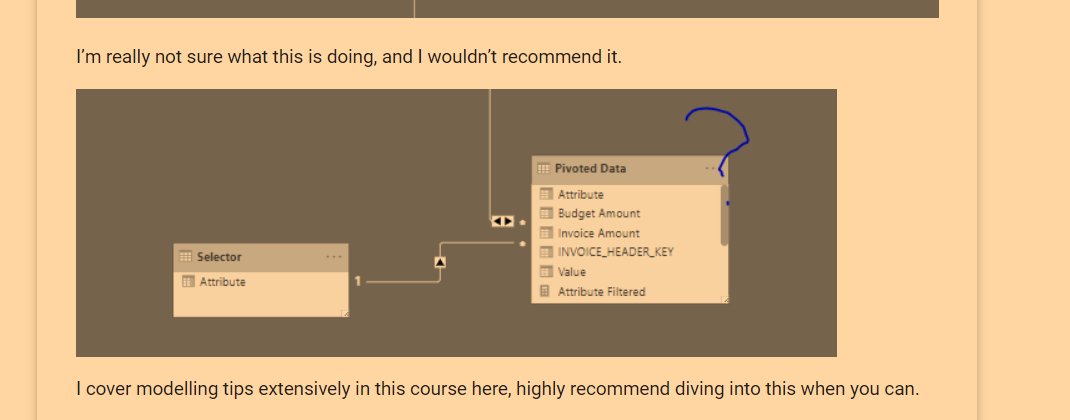
I guess now after seeing why you are doing this it makes a little more sense. It’s an interesting technique. Not one I’ve used a lot myself.
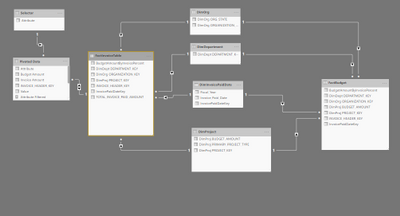
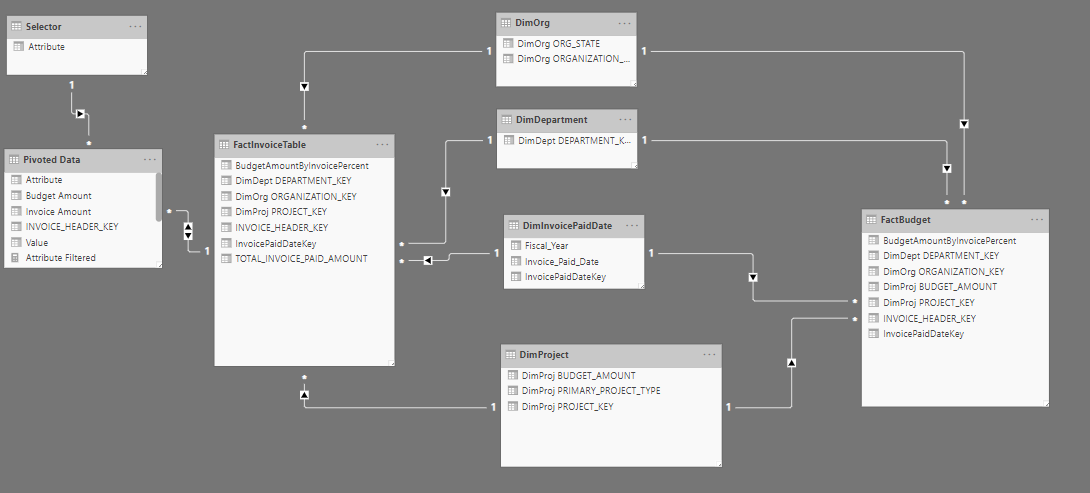
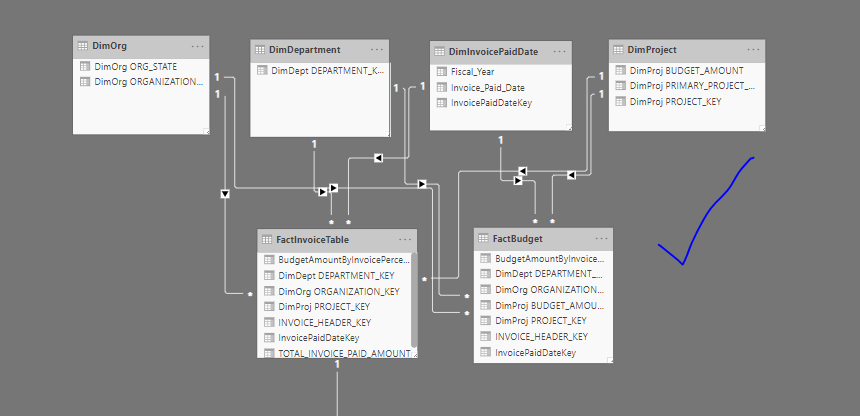
I would definitely look to organize you model still in the way I’ve described but look to place this somewhere so that it all flows seamlessly and is easy to understand.
Have you investigated the tutorial above utilizing the TOPN and RANKX functions. I think you should be able to get the calculations done here using the TOPN function. Let me know how you have got on testing this out.
I don’t recommend using the topnslicer functionality inside of Power BI, always look to write measures at all times. This is how you harness the immense analytical power contained within Power BI. You can then look to build on this in other calculations etc.
I have, I spent the last week working with Dynamic Attribute Slicers, Dynamic Measure Slicers, and combining it with TopN/RankX slicer table. Haven’t been able to get the logic. I know what needs to happen.
I’ll post this in another topic to open it up to everyone. Getting these 3 dynamic slicers would really help satisfy end users and help Power BI visualization makers succeed.
I really looked into your Global Statistics Power BI viz and worked from there.