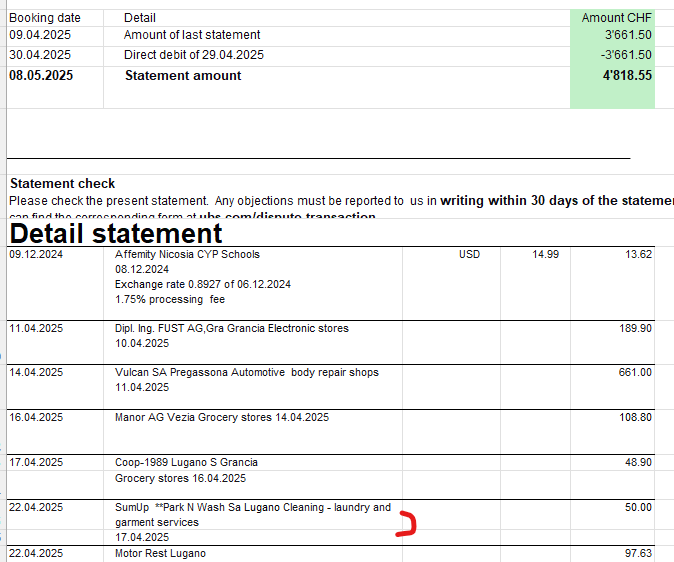
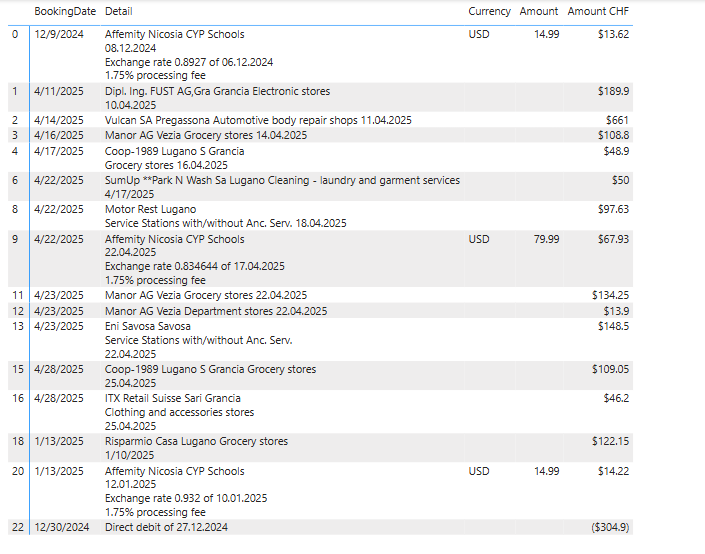
Below is my observation and solution, hope this helps! The data was scattered, headers were repeated, and there was no clear way to identify where one transaction ended and the next began. But I noticed one consistent clue: every new transaction had a value in the “Amount CHF” column. That became my anchor.
Here’s how I cleaned it all up and grouped the details for each transaction using Power Query.
 Step 1: Remove Empty Columns
First, I used a custom function to remove any columns that were completely blank. This helped me focus only on the columns that actually had data.
 Step 2: Find the Start of Real Data
Since the PDF dump included a lot of junk at the top, I searched for the word "Detail" in the first column. That marked the beginning of the actual transaction data. I removed everything above it.
 Step 3: Skip the Repeated Header Row
Right after the "Detail" marker, there was a row that repeated the column headers. I skipped that too.
 Step 4: Rename Columns
The columns had generic names like Column1, Column2, etc. I renamed them to meaningful names like "BookingDate", "Detail", "Currency", "Amount", and "Amount CHF".
 Step 5: Remove Extra Header Rows
Some rows still had header-like text (e.g., "Booking date" in the BookingDate column). I filtered those out.
 Step 6: Fix Data Types
I converted each column to its correct data type — dates, text, numbers, and currency — so everything would behave properly in calculations and filters.
 Step 7: Remove Unwanted Rows
I didn’t need rows that said "Amount carried forward" in the Detail column, so I filtered those out too.
 Step 8: Create a Transaction Index
Since the PDF didn’t give me a transaction ID, I made one myself:
- I added a row number to track each row.
- Then I marked rows where
"Amount CHF" was filled — these are the start of each transaction.
- I filled that index down into the blank rows below so all related rows shared the same transaction ID.
 Step 9: Group the Data
Finally, I grouped all rows by this new transaction index:
- I combined all the
Detail text into one block using line breaks.
- I kept the first value from other columns like
BookingDate, Currency, and Amount.
 The Result
I ended up with a clean, structured table where each transaction is grouped together, all the details are merged into one readable block, and the rest of the data is neatly aligned. From a messy PDF to a usable dataset — all thanks to Power Query!
 Bonus Tip: Try Importing the PDF Directly into Power BI
If you’re starting fresh, Power BI actually lets you import PDF files directly. It can detect tables and extract them into Power Query, saving you a lot of manual cleanup.
Here’s a great YouTube tutorial that walks through the process:
 How to “automatically” extract data from a messy PDF table to Excel1
Give it a try before manually copying data — it might just save you hours!
Sample.pbix (31.0 KB)


