How do I combine 2 TABLE VISUALS to get measures synced up.
I have 2 different datasets which doesn’t talk to each other.
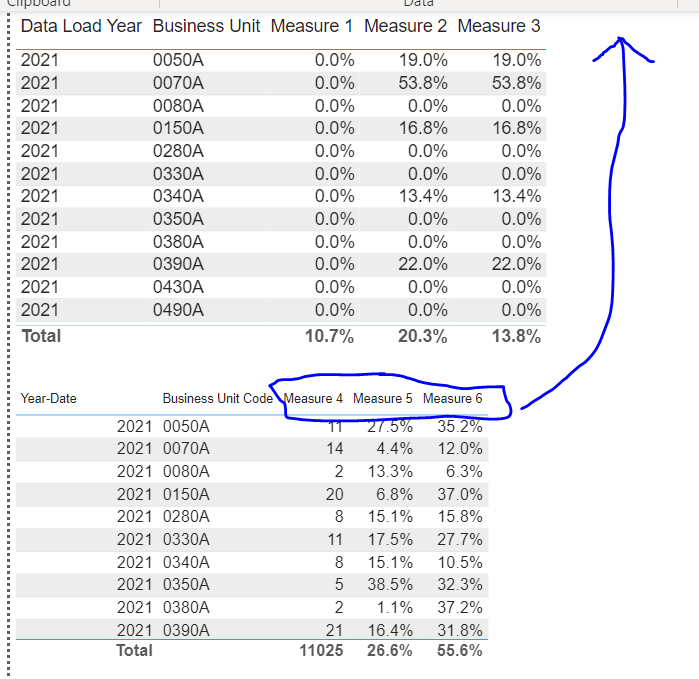
I have created 2 different table visuals.
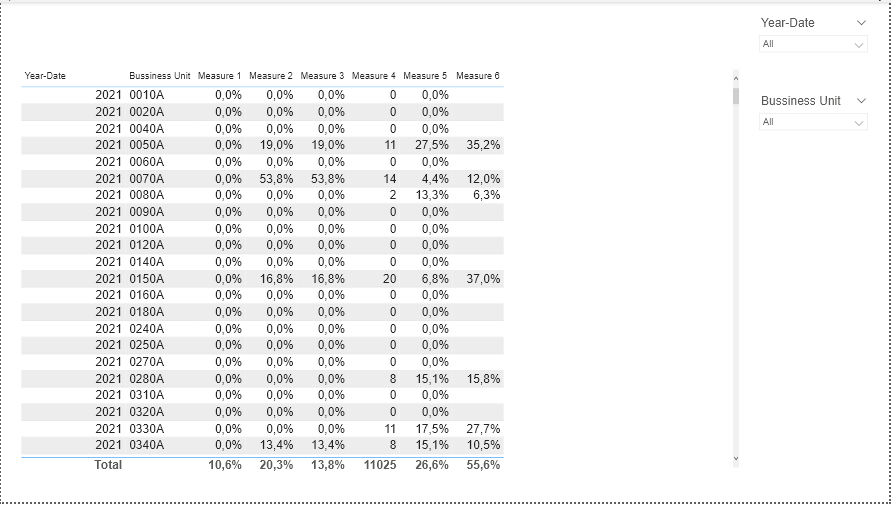
What I am looking for is: how do I combine these 2 together so I can see Measure 4, Measure 5 and Measure 6 along with Measure 1, Measure 2 and Measure 3.
I am looking for something akin to “merge” function in Power Query but at the table visual level.
I tried to create a Custom column where I concatenated “Year and Business Unit” and created custom column and then joined both custom column (Many to many) in Power Query and created a join. But that gave me very weird answers.
Hi @rit372002,
Thank you very much for posting your query in the forum.
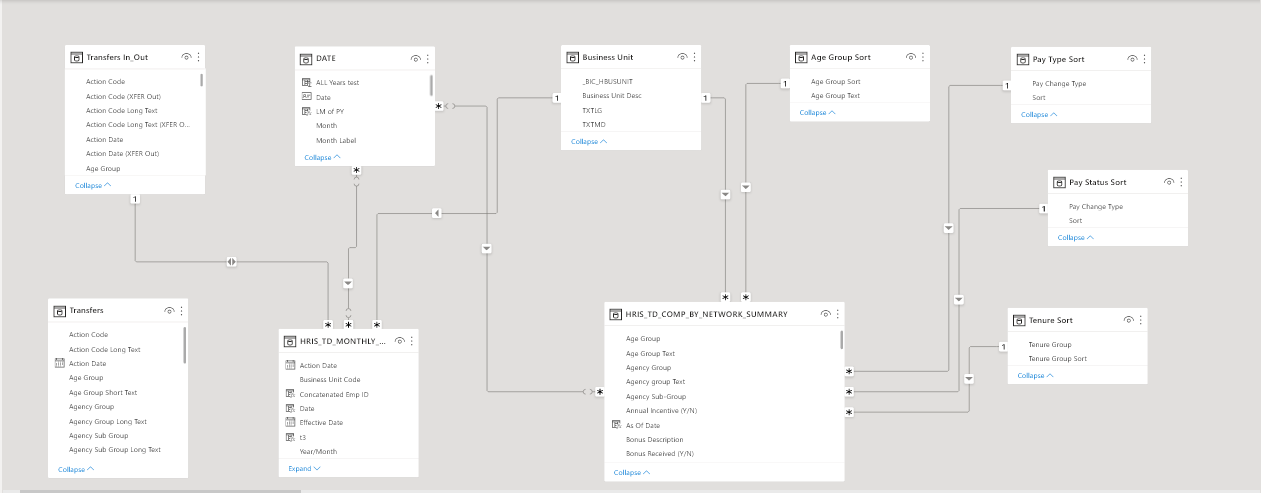
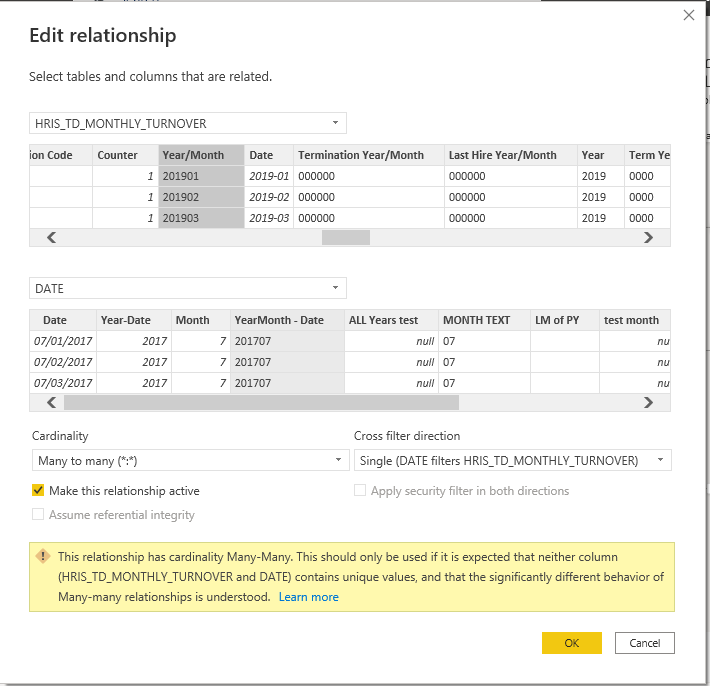
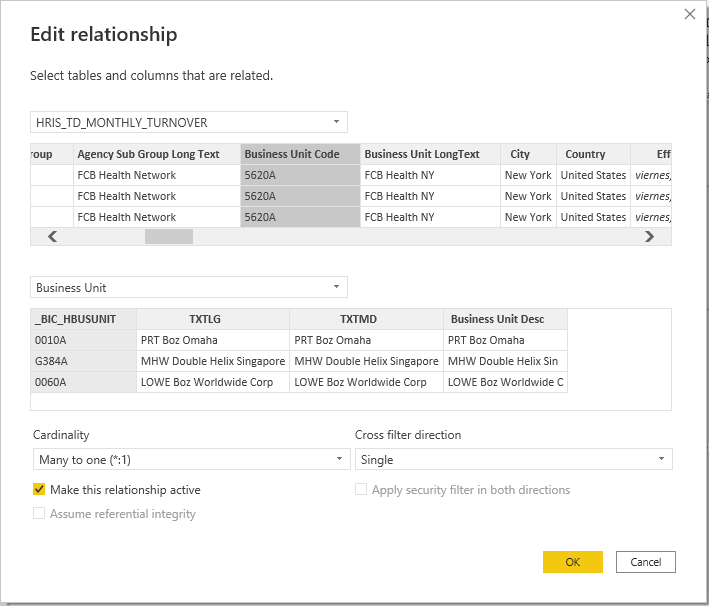
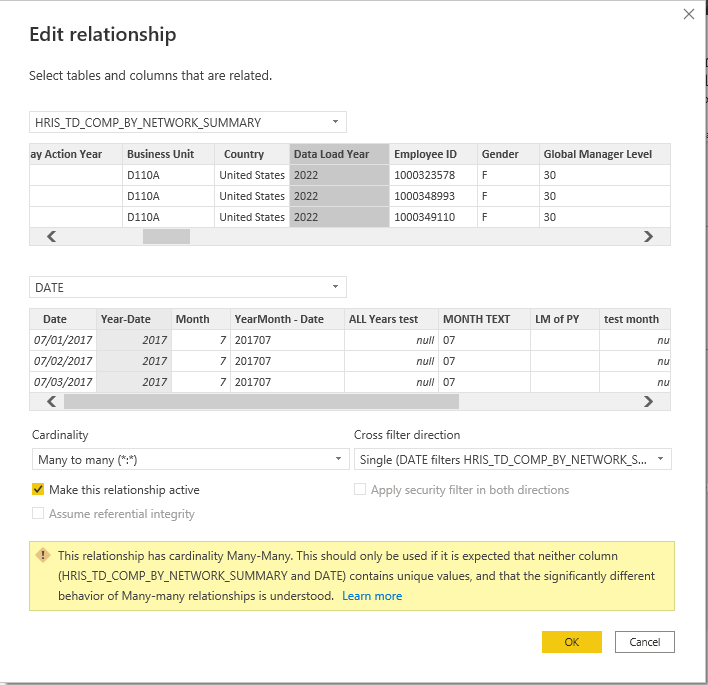
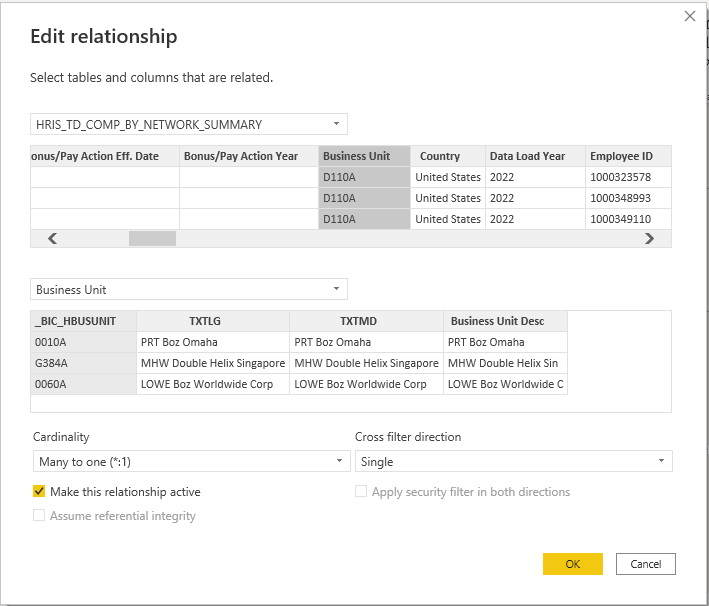
I share a possible solution in which I have modified the data model so that both fact tables are filtered by the same DATES and Business Unit dimension tables.
Thanks @jafernandezpuga , first I created a distinctkey column in both the fact table by concatenating few columns.
then I created 2 lookup tables (creating by referencing the 2 fact tables and removed all the other columns) with business unit and other dimensions that I needed. and then I appended those 2 tables and took out all duplicates.
Once the dimension table in place, I connected both the fact tables based on the distinctkey from this dimension table.
I think that’s what you ended up doing it as well without creating lookup tables. I will checkout your solution as well.