I have an odd problem with the total column in my matrix. If I change the date filter by one day (in this case to exclude 31/7) the value in the total column disappears, as per the attached vid. Any ideas?
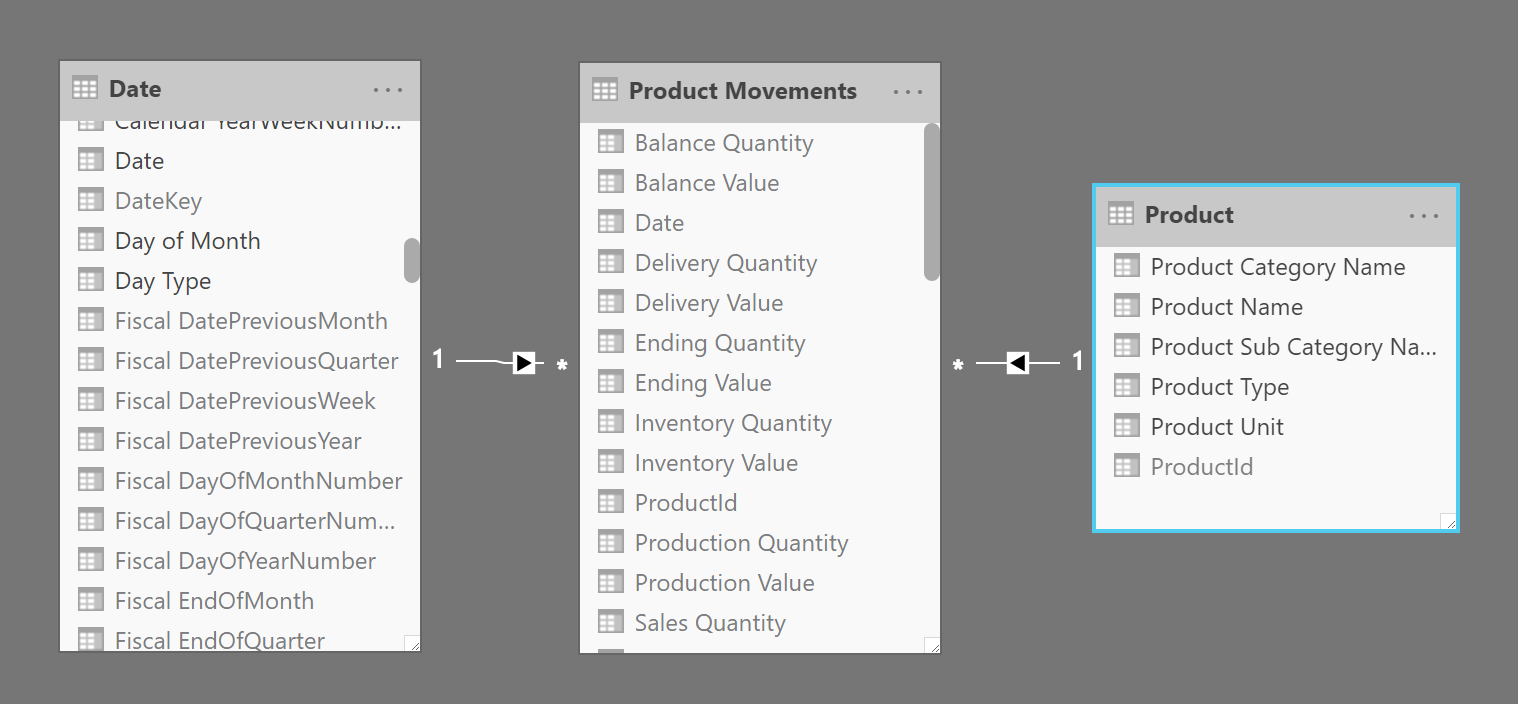
Hi Nick, thanks for the reply. Am attaching screenshots of the relationships and the report construction - is this enough? The value is just a straightforward SUM.

What filters do you have on your page though? I think this is where the issue will likely stem from.
I would recommend here also having a good think about somehow placing the filter on the report page. You have to remember that the end user can’t change anything in this area once you publish the report.
Sam
Hi,
There are no filters on the report or the page (see my earlier screenshot). I think I did previously have one, but moved it to the visual for the purpose of testing - same result.
The column total only disappears when I set a relative number of days that starts after 31/7. Oddly enough if I set advancing filter for any date from 1/8 it works. But as I want a rolling ‘last 7 days’ this won’t work. Any ideas as to why the date filtering would cause this issue? Any suggested workarounds?
What’s the measure you are using for that? Would it be possible to upload some data though? Even if it’s just some dummy data that represents your actual data set. Screenshots have their place, but for me I need to be “in the trenches” ![]()
![]()
I’m not using a measure to get the last 7 days - am just using the relative date filter. It works fine as long as the start date is before Aug 1, but if the number of dates is less the column total disappears. I’ll try and re-create this in a new file with a minimum amount of data.
I can’t recreate it in a new file unfortunately, and the file I’m working with is too large/sensitive to upload. My only hope is that someone has faced an issue with the column totals disappearing due to a change in the relative date filter.
What’s the measure you are using to get the figures?
Does the same thing happen if you use a Slicer with Date from Date table?
Is your date table marked as a date table?
I did a simple test on my end and I couldn’t replicate. Though was just a simple sales table and date table. I’m thinking there could be something else in play in your model
![]()
Hi Nick, answers as follows -
- The measure is a simple SUM,
- I get the same issue if I use a date slicer, instead of a date filter.
- Yes, my Date table is marked as a date table.
Note that I use another PBI file as my data set. I was able to recreate the problem directly within the data set. However, I then added a measure from a different table to the matrix, and that measure does show a total. The original table does have an aggregated table attached to it, so I’m wondering if it could be connected to that?
Thanks again for your input - it’s most appreciated!
hmm… Now that may be an issue. There’s always a reason for things, just need to find it. I’ll think on this and see what I can come up with
![]()
I get the same problem in the data set though. The only thing I can isolate this to is the table that the measure runs on (all other measures from that table have the same problem). For that table I created an aggregated table that groups by the month. But as I’m looking at this by the day that shouldn’t be hit.
I’ve worked around this for now be adding the visual that shows movements over a period of time, but it would be nice to get to the bottom of this - its really odd how the column total disappears when the selected date filter changes to cover just one month.