I have a data set of thousands of line items. Each line item represents a user who logs into our network. When they log in they can do any or all of the actions (phone, notebook, computer). I want to be able to create a new column and have it tell me
a) The people who logged in and ONLY used phone (in the test data set that would be SAM)
b) The people who logged in and ONLY used computer and notebook (in the test data that would be Joe).
I was wondering if it was easier to do sometime in PowerQ to create a new column?RAP Whitelist - EDNA.pbix (17.3 KB)
Thanks
Chad
@chad.sharpe for a large row table you may want to consider a measure solution instead of a calculated column solution for performance.
Here I have created a way to figure out which users are phone only or non-phone only. Then using a calculation group technique that @MudassirAli has demonstrated I can make it a slicer. https://youtu.be/GH1n0hfqbBw
Also see: Top 10 uses for Calculation Groups — Apex Insights: Power BI tips & tricks
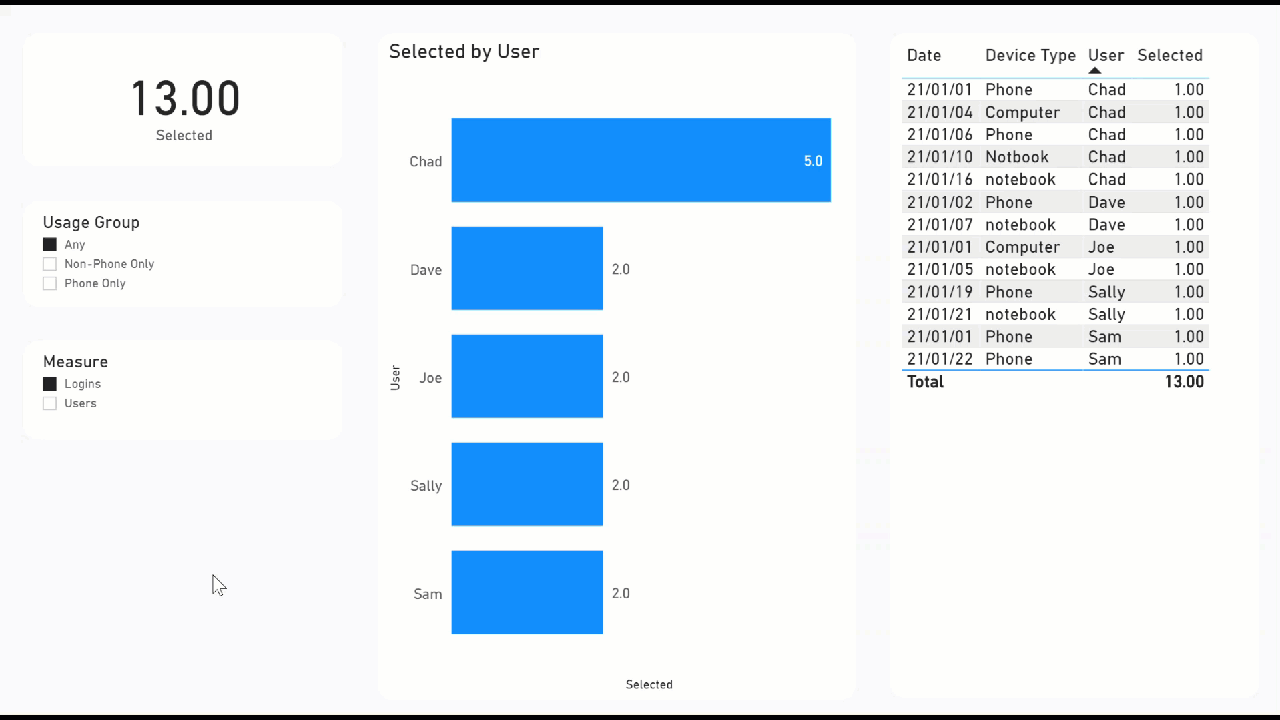
The measures use this logic:
Logins = COUNTROWS ( Sheet1 )
Logins for Phone = CALCULATE ( [Logins], Sheet1[Device Type] = "Phone" )
Logins for Computer or Notebook = CALCULATE ( [Logins], Sheet1[Device Type] IN { "Computer", "Notebook" } )
Phone Only = CALCULATE (
    SUMX (
        VALUES ( Sheet1[User] ),
        IF ( [Logins] = [Logins for Phone], [Selected], BLANK () )
    ),
    REMOVEFILTERS ( Sheet1[Date], Sheet1[Device Type] )
)

Non-Phone Only = CALCULATE (
    SUMX (
        VALUES ( Sheet1[User] ),
        IF ( [Logins] = [Logins for Computer or Notebook], [Selected], BLANK () )
    ),
    REMOVEFILTERS ( Sheet1[Date], Sheet1[Device Type] )
)
The selected is just a way to switch between showing [Users] or [Logins] for these users.
Respectfully,
DataZoe
RAP Whitelist - EDNA.pbix (24.4 KB)
4 Likes
Wow… this is exactly what i was looking for… This is great!
I’ll take a look at the video solutions you have provided as well…
1 Like