Column chart for month with custom 'Prior' and 'Future' months columns!

Hi,

We have an Order table which contains Order Date and Delivery Dates. An order taken in one month may not be delivered until many months later.

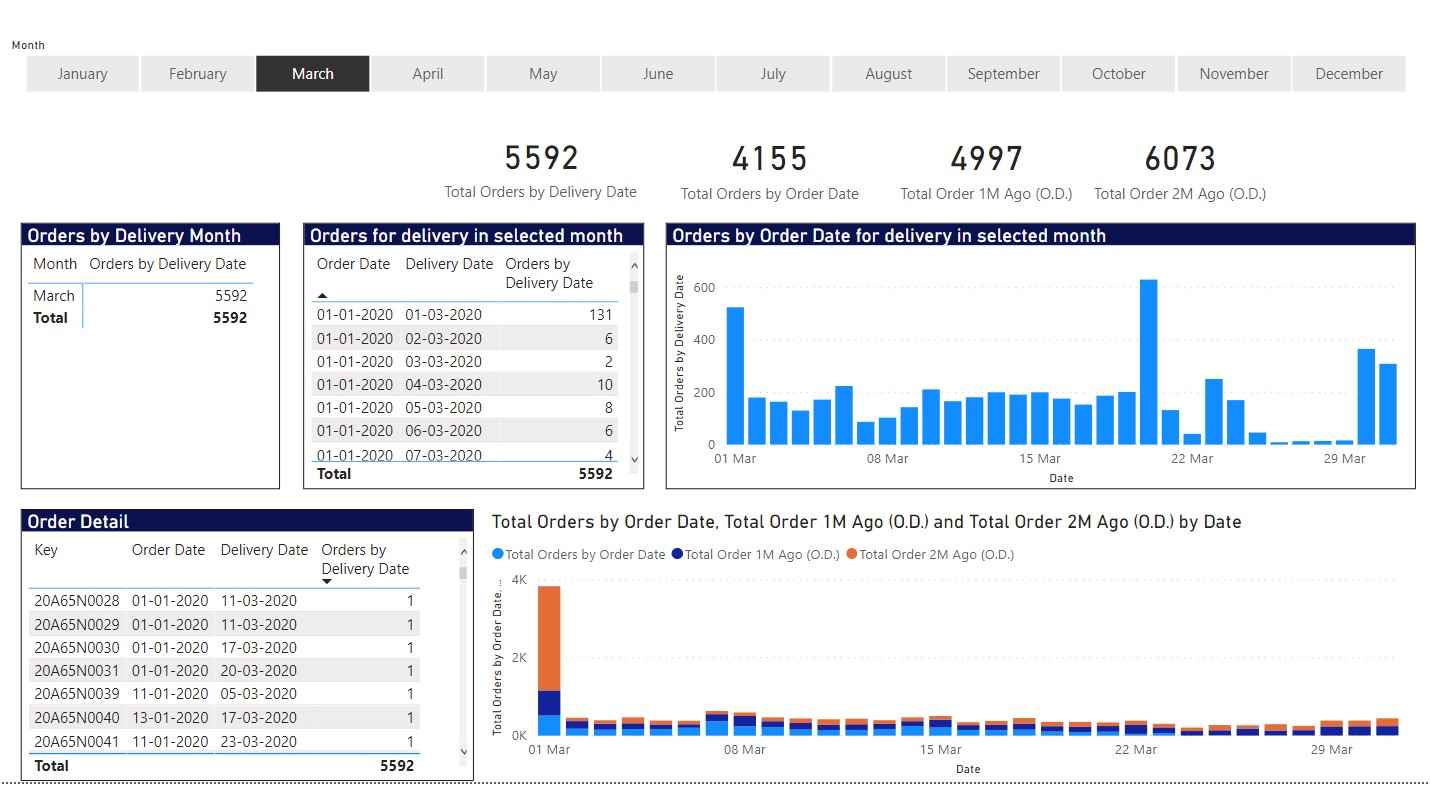
My users would like to see a column chart which visualizes the number of orders, by Order Date for a given delivery month, but which additionally includes some custom columns which will capture and group all orders for any previous order date months into custom columns, such as Prior Month (PM), Prior Month 2 (PM2), Prior Month 3 and before (PM3+) and also Future, to capture orders with an incorrect order date ahead of its delivery date.

Mock up example:

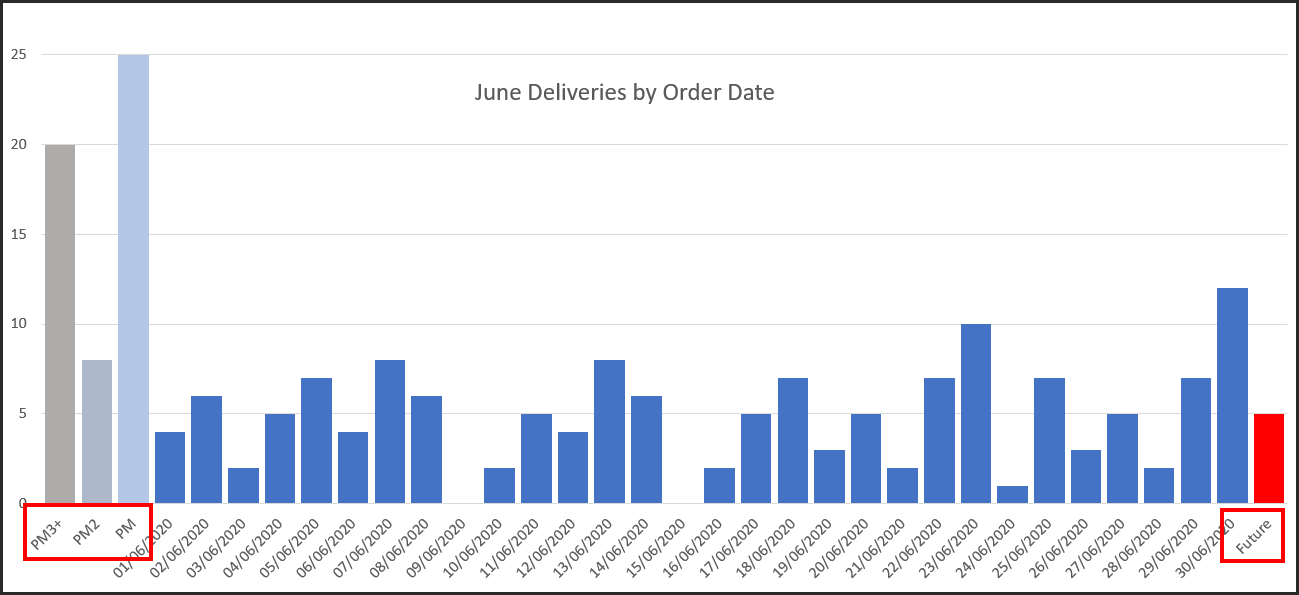
The reason for this request is that without this, we could have in excess of 200 dates plotted on a chart, whereas the users really want to focus on how we are performing with orders in the current month, whilst retaining the visibility of volume from previous months.

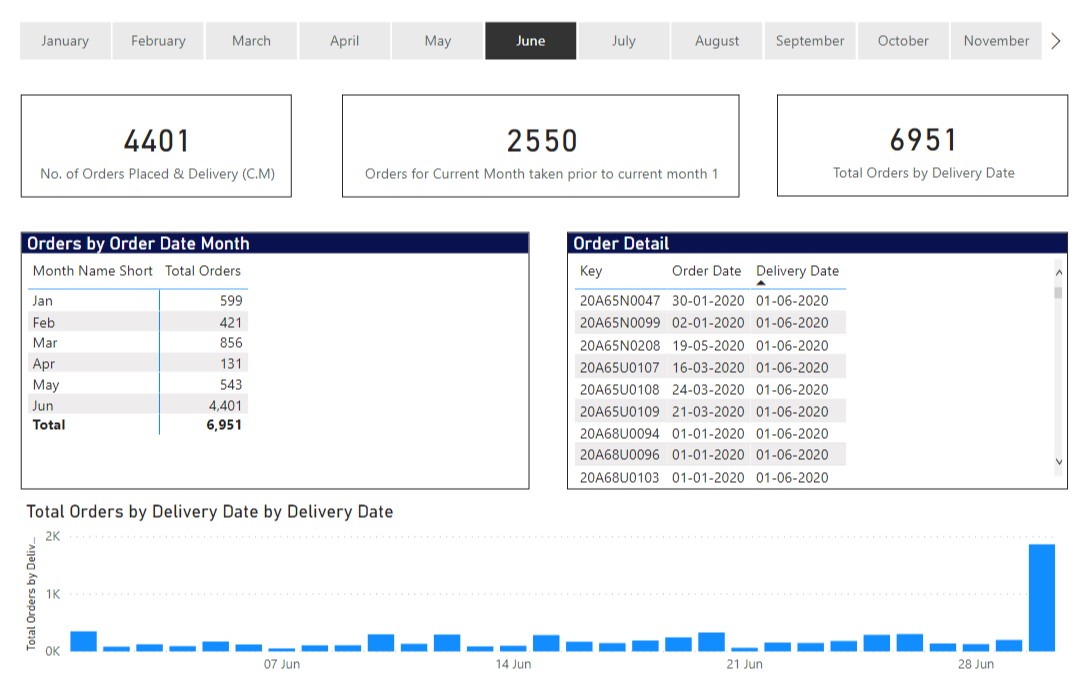
I have had a crack at putting together an initial mock up to see if I could achieve this, but it is far from perfect - please see attached.

Orders for Delivery Month v1.pbix (415.9 KB)

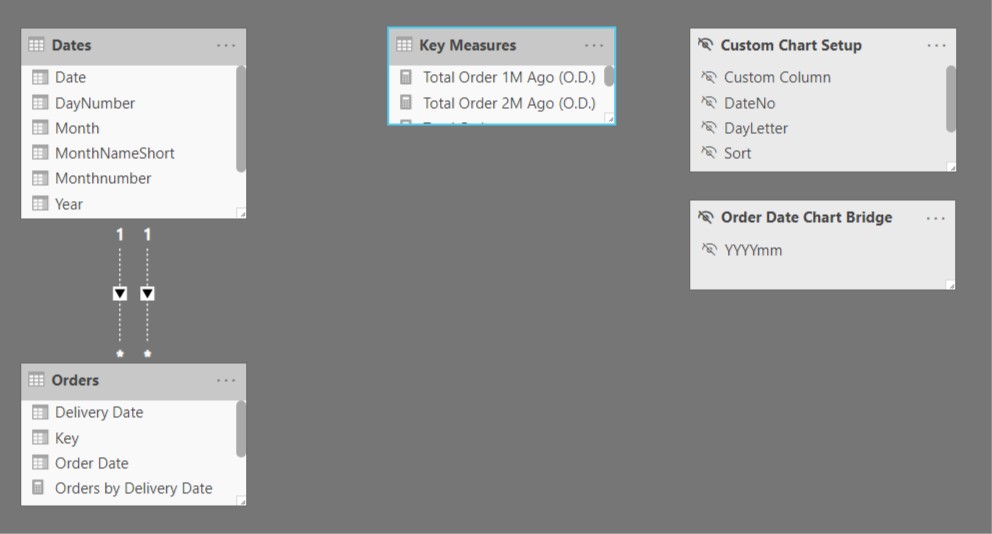
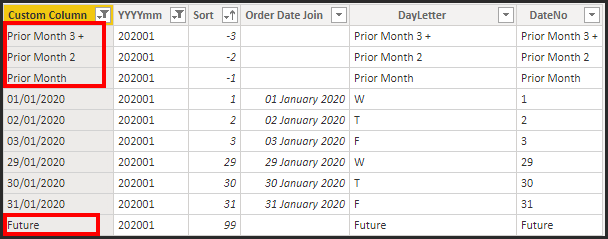
To be able to create the custom buckets on the X Axis, I need actual values in my data. The way I have done this is to create a table called Custom Chart Setup, which is essentially a copy of a basic date table and then added 4 rows to each month.

image

I have then created a measure [Orders for Custom Column Chart] which checks to see what the selected value of the Custom Column is. If it is one of the Prior Months, then it calculates the number of orders in for that relevant time period. If it is not one of the 4 custom values, it calculates the number of orders for that date value.

Orders for Custom Column Chart = 
VAR __selVal = SELECTEDVALUE('Custom Chart Setup'[Custom Column])
Var __SelDate = SELECTEDVALUE('Custom Chart Setup'[True Order Date])
VAR __StartDate = MIN(Dates[Date])
VAR __EndDate = MAX(Dates[Date])
RETURN
IF(__selVal = {"Prior Month"},  CALCULATE([Orders by Delivery Date], Orders[Order Date] >=     date(2020,5,1) && Orders[Order Date] <= date(2020,5,31)),
    IF(__selVal = {"Prior Month 2"},  CALCULATE([Orders by Delivery Date], Orders[Order Date] >=     date(2020,4,1) && Orders[Order Date] <= date(2020,4,30)),
        IF(__selVal = {"Prior Month 3 +"},  CALCULATE([Orders by Delivery Date], Orders[Order Date] < date(2020,4,1)),
            IF(__selVal = "Future",  CALCULATE([Orders by Delivery Date], Orders[Order Date] > __EndDate),
                CALCULATE([Orders by Delivery Date], Orders[Order Date] = __selDate))
            )
        )   
    )

Result in Power BI

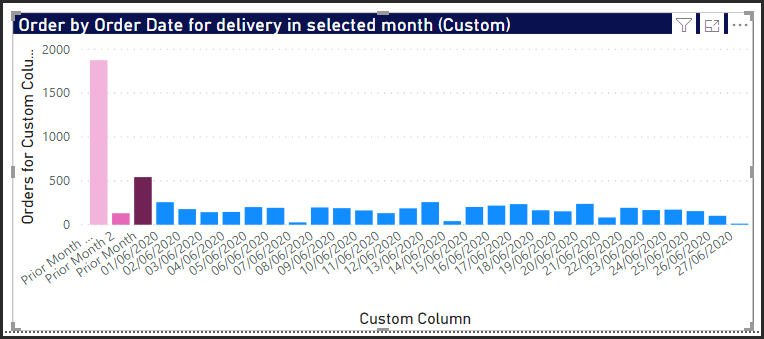
Whilst this works for the chart, it does not allow the user to successfully cross filter from the chart to the Order Detail table. I would like them to be able to click on the Prior Month column and for the Order Detail table to filter to these orders only. This is because there is no relationship between my Orders table and my Custom Chart Setup and I canā€™t see how one could be created, as the ā€˜Prior Monthā€™ assignments are dynamic.

So questions are:
1, Is there a better way of doing this? Or should it be abandoned now and never re-visited :laughing:
2, Is there a way to relate it to my Orders table so cross filtering would work.
3, In my measure, for Prior Month 3, 2, 1, I have temporarily hard coded the dates to May 2020, April 2020 and Pre April 2020. This was because I was struggling to do time calculations based on my MIN Dates[Date] value, as it needs to be a column of values to do DATEADD etc. Is there a way to do this in DAX for a fixed date?

Thanks for taking the time to read and any feedback greatly appreciated.

Mark

Use of dateadd function will really make it quite easy for your and make your DAX simple. Mr. SAM has explained it very well across the courses including the following:

All the best

Hello @Mark,

Thank you posting your query onto the Forum.

I would like to provide several tips -

  1. There was no requirement to create tables such as ā€œOrder Date Chart Bridgeā€ because on Enterprise DNA forum there is a full - fledged code of creating ā€œDateā€ Table which was created by @Melissa.

  2. Thereā€™s also no requirement to create a ā€œCustom Chart Setupā€ table since this objective can be fulfilled by using appropriate DAX measures and by using appropriate charts. You can have your ā€œCustom Chartsā€ setup if you strictly following some kind of analysis which can only be achieved by using such charts such as Financial Analysis which includes P&L Statement, Balance Sheet, Cash Flow Statements, Funds Flow Statement, etc.

In the given PBIX file, Iā€™ve used only ā€œFact Tableā€ i.e. ā€œOrdersā€ table and ā€œDatesā€ table and have discarded the relationship of other 2 tables and have also hidden it in the Report View. Below is the screenshot attached for the reference.

Iā€™m also attaching the screenshot of Analysis as well as the PBIX file of my working for the reference.

And also as suggested by @piryani you can also refer the the videos on Time Intelligence have better understanding of each formulas.

Hoping you find this useful and helps you to achieve the desired analysis. :slightly_smiling_face:

Please feel free to write back in case Iā€™ve missed out on anything.

Thanks & Warm Regards,
Harsh

Orders for Delivery Month v1.pbix (422.3 KB)

1 Like

Hi @Harsh and @piryanim thank you both for taking the time to look and for your responses.

@Harsh, thanks in particular for your pbix solution file. Please see my comments below:

1, I do prefer the simpler approach, however it doesnā€™t quite match the requirement, which was to clearly see in the visual, the volume of orders belonging to prior periods. Instead these older orders are overlaid on the dates belonging to the currently filtered month. So when I look at 26/06/20 I can see we had 138 orders placed on that day, but also 44 units place on that day less one month, eg 26/05/20. This to me isnā€™t particularly clear.

2, I also canā€™t find a way that when I click on the 44 units for 1M ago on the 26/06/20, that it filters the Order Detail table, just to show these 44 lines?


Going back to the brief, I have decided to take a different approach and one which will keep the model simple, however I am struggling with the concept of having two dates in the same tableā€¦

I still want to report on Orders for Delivery in a given month, so for my example June. For these orders with a June Delivery Date, I want analyse the split by Order Date Month.

So I effectively want to use the date table twice, once to filter orders with a June Delivery Date, but then for these records, to use the Date table columns (such as Month or Day of Week) to see the split of these orders by their Order Date.

I have mocked up a new report page (please ignore the rough formatting and presentation), please see attached: Orders for Delivery Month v2.pbix (434.8 KB)

Currently the ticks are good, but the crosses are wrong.

  • The middle card is returning the number of orders placed in June, whereas it needs to be the number of orders placed in June for Delivery in June.
  • The right hand card is currently just displaying 1, but it needs to be the sum of orders for Delivery In June, which were taken prior to June.
  • The middle table needs to report against columns from the Date table, such as Month, but again for Orders for Delivery in June, but split by Order Date Mont, eg March, April, May etc. This will satisfy the users so that they can see the volume of orders from previous months AND hopefully allow them to filter to these in the Order Detail tab.

It is this concept of handling multiple dates, filtering by one, but reporting against another which I am struggling with. Any assistance here would be so helpful!

Thanks again,

Mark

Hello @Mark,

Please find the screenshot provided below -

Iā€™m providing my remarks against the suggestions provided by you.

  1. The middle card is returning the number of orders placed in June, whereas it needs to be the number of orders placed in June for Delivery in June. - "You can refer the 1st Card Visual".

  2. The right hand card is currently just displaying 1, but it needs to be the sum of orders for Delivery In June, which were taken prior to June. - "You can refer the 4th Card Visual which shows value as 12363."

  3. The middle table needs to report against columns from the Date table, such as Month, but again for Orders for Delivery in June, but split by Order Date Mont, eg March, April, May etc. This will satisfy the users so that they can see the volume of orders from previous months AND hopefully allow them to filter to these in the Order Detail tab. - ā€œYou can refer the 1st Table.ā€

  4. "The remaining 2 card visual are placed for cross - checking the numbers and as per my understanding Iā€™ve put the Measure in the 2 table".

Iā€™m also attaching the PBIX file of the working for the reference.

Hoping you find this useful and helps you to achieve the desired analysis.

Thanks & Warm Regards,
Harsh

Orders for Delivery Month v2.pbix (422.4 KB)

Hi @Harsh

Again, thank you for your quick reply, but I donā€™t think we have understood each other fully :slight_smile:

1, The middle card is returning the number of orders placed in June, whereas it needs to be the number of orders placed in June for Delivery in June. - " You can refer the 1st Card Visual" .

This is not correct. We have 6,951 order with a Delivery Date in June. In the middle card I need to know how many of the 6,951 orders were actually Ordered in June (Where Order Date is in June). This should be 4,401.

2, The right hand card is currently just displaying 1, but it needs to be the sum of orders for Delivery In June, which were taken prior to June. - " You can refer the 4th Card Visual which shows value as 12363."

This should be a count of orders, again with a Delivery Date in June, but which have an Order Date prior to June. The correct answer should be 2,550.

3, The middle table needs to report against columns from the Date table, such as Month, but again for Orders for Delivery in June, but split by Order Date Mont, eg March, April, May etc. This will satisfy the users so that they can see the volume of orders from previous months AND hopefully allow them to filter to these in the Order Detail tab. - ā€œ You can refer the 1st Table. ā€

Again, unfortunatley not. I want to see Junes 6,951 orders, split across the months they were Ordered. So it should look like:
image

Please see attached my new solution, where I have fixed the cards and also created the Matrix above.
Orders for Delivery Month v3.pbix (428.9 KB)

However I was only able to do this by creating a 2nd Date table ā€˜Order Datesā€™ and linking this to Orders on Order Date. The Slicer on my main Dates table, filters Orders to June. I have then had to use the 2nd Order Dates table to visualise the split of Orders by month they were ordered.

Is there a way to do this without having to use a 2nd dates table?

Many thanks again for your time looking at this :grin:

Hello @Mark,

My sincere and deepest apologies where I had to withdraw my post.

Below is the screenshot provided for the reference. "Iā€™ve achieved the same results by activating one of the relationship i.e. between Order[Delivery Date] column and Dates[Dates] column since most of your analysis was based on Delivery Date."

The only which concerns me is the graph total i.e. in my graph itā€™s showing a total of 6951 whereas in your graph itā€™s showing a total of 4401 where the logic applied is exactly same.

And itā€™s great where youā€™re able to achieve the analysis by two date tables in your data following the best practices of data modelling.

Sam has in his videos also has agreed that you can use two date tables at all if required and most importantly by following the best data modelling techniques so that we donā€™t face performance issues in our report.

Iā€™m attaching the PBIX file of the working for the reference.

Thanks & Regards,
Harsh

Orders for Delivery Month v3.pbix (431.1 KB)

Hi @Mark,

1 - For orders Ordered in June with Delivery Date in June

No. of Orders Placed & Delivery (C.M) =
VAR DDorders = CALCULATETABLE( VALUES(Orders[Key]), FILTER( VALUES( Orders[Order Date] ), Orders[Order Date] >= MIN( Dates[Date] )))
VAR ODorders = CALCULATETABLE( VALUES( Orders[Key] ), FILTER( VALUES( Orders[Delivery Date] ), Orders[Delivery Date] <= MAX( Dates[Date] )))
RETURN

COUNTROWS( INTERSECT( DDorders, ODorders )) 

.

2 - For Orders with a Delivery Date in June but an Order Date prior to June

Total Order till P.M. (D.D.) =
VAR DDorders = CALCULATETABLE( VALUES(Orders[Key]), USERELATIONSHIP( Dates[Date] , Orders[Delivery Date] ) )
VAR ODorders = CALCULATETABLE( VALUES( Orders[Key] ), USERELATIONSHIP( Dates[Date] , Orders[Order Date] ), FILTER( ALL( Dates ), Dates[Date] < MIN( Dates[Date] )))
RETURN

COUNTROWS( INTERSECT( DDorders, ODorders ))

.

3 - Yeah think you might need a second Date table to be able to visualize it like thatā€¦
.

I hope this is helpful.

Hi @Mark, did the response provided by the contributors help you solve your query? If not, how far did you get, and what kind of help you need further? If yes, kindly mark the thread as solved. Thanks!

Hi @Harsh and @Melissa

Apologies for the delay in coming back to you and thanks again for your inputs.

@Harsh - Great idea to use the Calculated Columns to create the Year and Month short columns for my matrix. Gives me some good food for thought.

@Melissa - Thanks also for the measures using INTERSECT - whilst I was aware of the function I havenā€™t used these before in Power BI but really cool to see a real world example.

Mark

Hello @Mark,

Youā€™re Welcome. :slightly_smiling_face:

Glad that weā€™re able to help you.

Thanks and Warm Regards,
Harsh