Hi
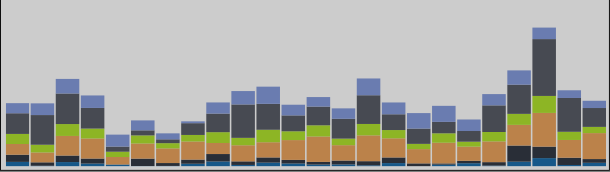
I create a Histogram view and sliced by a Fact attribute, using the “Legend” option of the chart options (see below snapshot)
But when I put the legend Power Bi automatically choose the color scheme to apply to the slicing of the data based on the attribute
I would like to have a report on Grey scale, if there any option to force the system to use a particolr combination.
It has to be automatic, as the slicing is dyamic choosen and the hard coding into the “data color” option would not work when I dyna,ically change the attribute to slice by
You can change the color scheme of reports by selecting/ designing a Theme.
Go to the View tab on the Ribbon, there you’ll find all standard available Themes
Here’s a link to the documentation on Themes
If a color theme you are looking for isn’t present by default you can check the Theme Gallery, Customize the current Theme or even create a Custom Theme for your report(s).
This tool can help you create a json for a custom theme.
As for the gray matter background, I can point you towards this theme:
Note that the visual does not work, but you can download the json on the bottom of the page and import as how Melissa describes in the “Use report themes in PBI Desktop” link.