Color mapping with Deneb

{
 
    "$schema": "https://vega.github.io/schema/vega-lite/v5.json",
 
    "title": {
 
        "text": "Residual Value Trend",
 
        "fontSize": 20,
 
        "anchor": "start",
 
        "color": "#243781",
 
        "offset": 15,
 
        "font": "calibri"
 
    },
 
    "description": "Linechart with Country and Car Models",
 
    "data": {
 
        "name": "dataset"
 
    },
 
    "transform": [
 
        {
 
            "calculate": " datum.RV < 100 ? datum.Rv + '%' : datum.RV >= 1000 ? format(datum.Rv,','):datum.Rv",
 
            "as": "Rv"
 
        }
 
    ],
 
    "encoding": {
      
           "detail": {
 
              "field": "Model-Fuel",
 
              "type": "nominal"
              
           },
        
 
        "color": {
 
            "field": "CD_ENERGY_CODE",
 
            "type": "nominal",
            
            "sort": {
 
                "field": "CD_ENERGY_CODE",
 
                "order": "ascending"
 
            },
 
                        
            "scale":{
              
              "domain":{
                
                "data": "dataset",
                
                "field": "CD_ENERGY_CODE"
        
              },
              
              "range":{
                
                "data":"dataset",
                
                "field": "ENERGY_COLOR"
                
              }
              
            },
 
            "legend": {
 
                "title": null,
 
                "labelFontSize": 16,
 
                "labelFont": "calibri"
 
            }
 
        },
 
        "x": {
 
            "field": "Visual Date",
 
            "type": "nominal",
 
            "axis": {
 
                "labelFontSize": 16,
 
                "title": null,
 
                "labelAngle": 0,
 
                "labelColor": "#243781",
 
                "tickColor": "transparent",
 
                "domainColor": "transparent",
 
                "labelFont": "calibri"
 
            }
 
        },
 
        "y": {
 
            "field": "RV %/RV €",
 
            "type": "quantitative",
 
            "axis": {
 
                "labelFontSize": 16,
 
                "grid": false,
 
                "title": null,
 
                "labelColor": "#243781",
 
                "tickColor": "transparent",
 
                "domainColor": "transparent",
 
                "labelFont": "calibri"
 
            },
 
            "scale": {
 
                "zero": false
 
            }
 
        }
 
    },
 
    "layer": [
 
        {
 
            "mark": {
 
                "type": "line",
 
                "strokeWidth": 4
 
            },
 
            "encoding": {
 
                "detail": {
 
                    "field": "Model-Fuel",
 
                    "type": "nominal"
 
                }
 
            }
 
        },
 
        {
 
            "mark": {
 
                "type": "point",
 
                "filled": true,
 
                "size": 60
 
            },
 
            "encoding": {
 
                "tooltip": [
 
                    {
 
                        "field": "Model-Fuel",
 
                        "type": "nominal"
 
                    },
 
                    {
 
                        "field": "Rv",
 
                        "type": "nominal"
 
                    }
 
                ]
 
            }
 
        }
 
    ]
 
}

That’s the code I’m using right now,
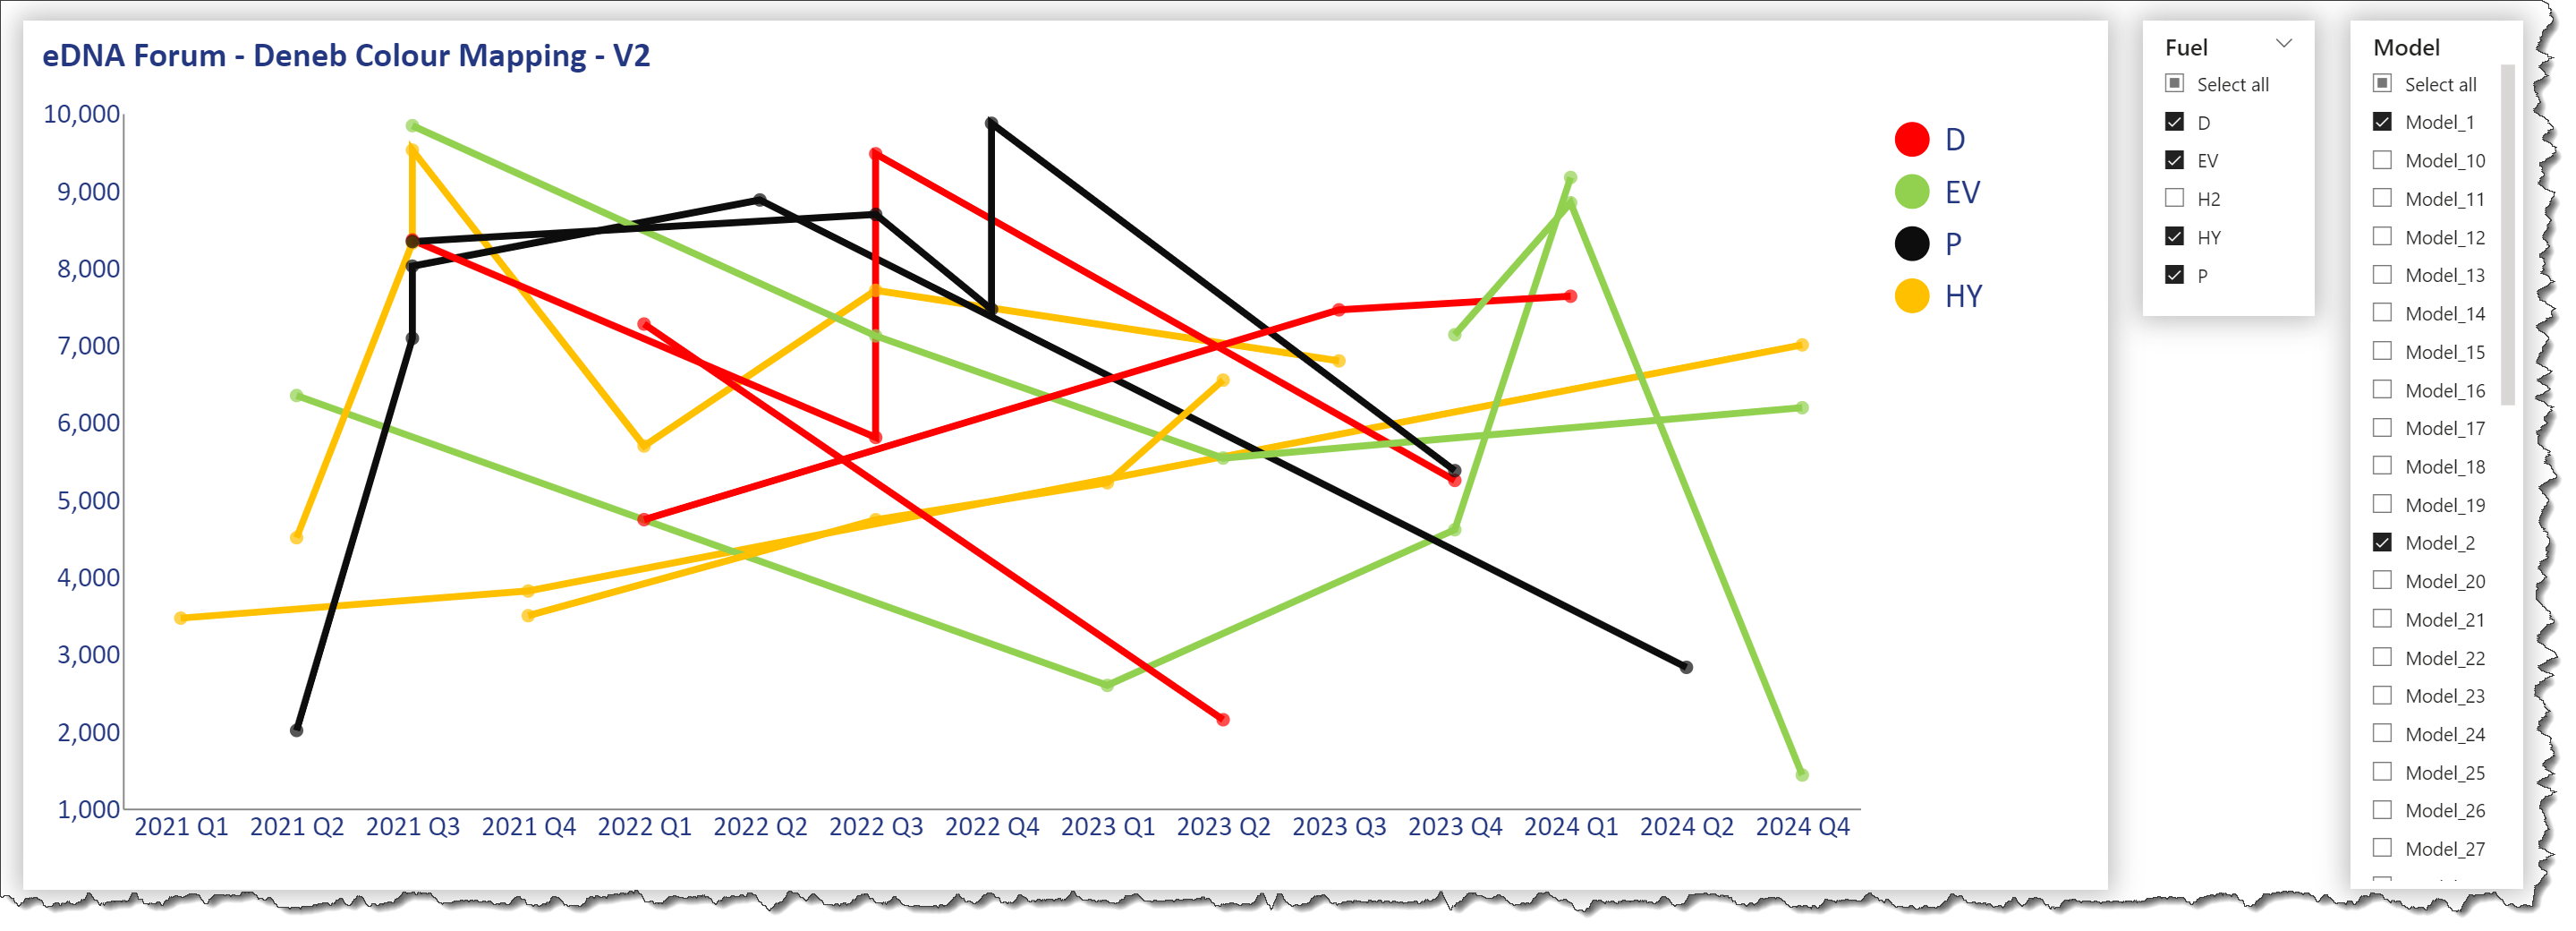
X axis are quantitative values
Y axis a date expressed in quarter “Es 2021 Q1”

The lines connecting the points are different veichles and I want to color them based on a table containing :
In the first column the type of fuel
In the second column the color associated to the fuel
The table with the colors is linked with the fact table with the type of the fuel column ,

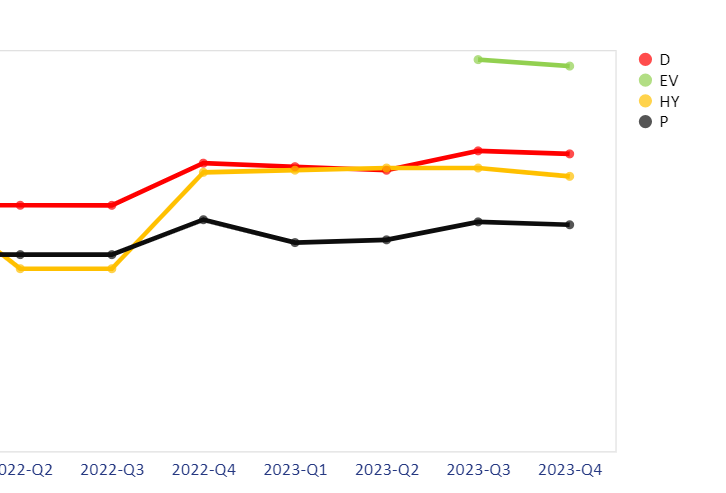
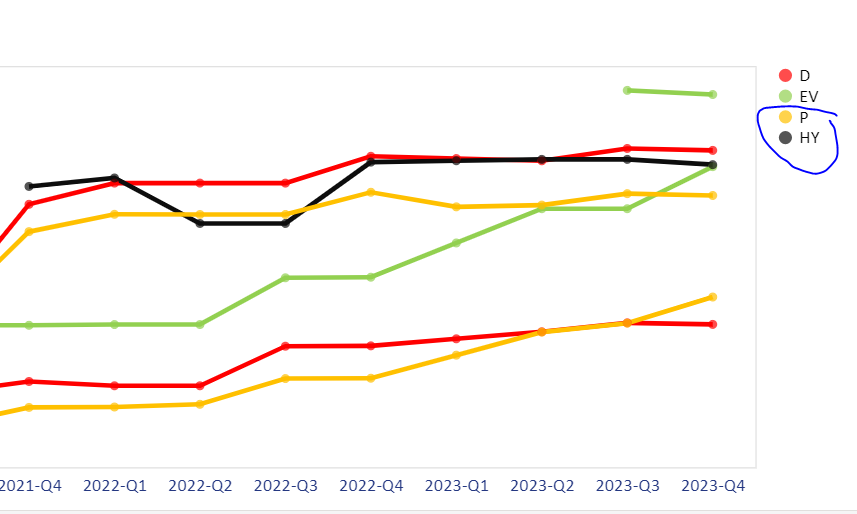
When I try to plot the line chart without selecting a specific fuel type from a slicer the colors shuffle between themselves, if I select only one it works , if I select more then one they start to shuffle again. That’s my problem.
Also I’m having the same problem on another visual with the same “mechanic”

I think I tried everything

Thanks in advance

Hi @tom071136.

You’ll need to add a color block to the encoding block to use your desired field.

To help us further analyze your current state and visualize your issue, could you please provide as many as you can of:

  • Your work-in-progress PBIX file, using sanitized data if necessary
  • Your dataset as an Excel file (again, sanitized if necessary)
  • A detailed mock-up (marked-up screenshot of the visual in question or Excel or PowerPoint file) showing your desired outcome.

Also, if you provide DAX, Power Query, or Deneb JSON code in your post, please format it using the built-in formatter.

Greg
_eDNA Forum - Format DAX or PQ

Hello Greg,

Below in the code you can see there it is the color block inside the encoding

Waiting for an answer

Best regards,

Tommaso

Please upload PBIX

Missed the provided (existing) color block … apologies … in any event, as its not working as expected, I’ll need to review the PBIX to proceed further, as any Deneb/Vega-Lite solution is heavily dataset dependent.
Greg

Sure,

I
deneb7E15AEF80B9E4D4F8E12924291ECE89A.1.6.2.1.pbix (1.6 MB)
FUEL_COLORS_TABLE.xlsx (9.3 KB)
AutoData.xlsx (26.7 KB)
created a similar concept of the one i’m working on right now , but the error is still the same, if you try to select more then one “Fuel” you will notice

Hi @tom071136.

In your transform block, what is datum.Rv?

  "transform": [
    {
      "calculate": " datum.Value < 100 ? datum.Value + '%' : datum.Value >= 1000 ? format(datum.Rv,','):datum.Value",
      "as": "Value"
    }
  ],

Greg

Hi @tom071136.

OK, I’ve played-around a with your example a bit, and am still not sure I understand your issue. If its simply the assignment of colours, then you can use the simpler example from the Vega-Lite website

So, in your case, the color block would be something like:

    "color": {
      "field": "ENERGY_COLOR",
      "type": "nominal",
      "scale": null
    },

If this isn’t what you’re looking for, please take screenshots of what you are getting and mark-up copies with what you are expecting; we can then take another look.

Greg
eDNA Forum - Deneb Colour Mapping.pbix (1.6 MB)

Hi Greg, sorry i didnt changed it , it is a field used in the tooltip of the project

Hi Greg , colors can’t be hard coded , i’m working on a similar linechart for with represented car models but colored by brands, and for the sake of longevity i need to have them not hard coded

Understood, but I’m still not clear about what you want … please create mockups of the current situation and your desired outcome and I’ll take another look tomorrow. Regarding the example you sent, the line chart is very chaotic as is, so a clarifying question(s) may be helpful as well.
Greg

Yes so the colors are defined in a table with a column for the fuel (primary key ) and a column for the color


And this is sort of how should it appear,
But if I select more then one or none the colors change between them

As you can see here

Hi @tom071136

The example PBIX I attached yesterday solves your issue. One side effect is that the legend is not displayed, so here’s another version using an “hconcat” composite visual (1st = line chart; 2nd = dedicated legend).

Notes:
- I used fuel = [D, EV, HY, P] and Model = [Model_1, Model_2, Model_3] to reduce the data displayed and thereby increase the clarity
- I removed the transform block with the non-existent datum.Rv field as it was unnecessary

To get the legend to use a custom sort order, you’ll need to add a field to your source, say ‘Energy Colours’[Sort]. I added a quick-and-dirty calculated column to my example using the code:

Sort = 
SWITCH(
  'Energy Colours'[CD_ENERGY_CODE],
    "D", 1,
    "EV", 2,
    "P", 3,
    "HY", 4,
    "H2", 5,
    99
)

I then used a calculate transform to combine the sort and label (so that the default Vega-Lite alphabetical sort would display the values in the desired order) and then a labelExpr/slice key:value pair to remove the sort value from the combined label.

Hope it helps.
Greg
eDNA Forum - Deneb Colour Mapping - V2.pbix (1.6 MB)

Thank you Greg !