HI @michellepace,
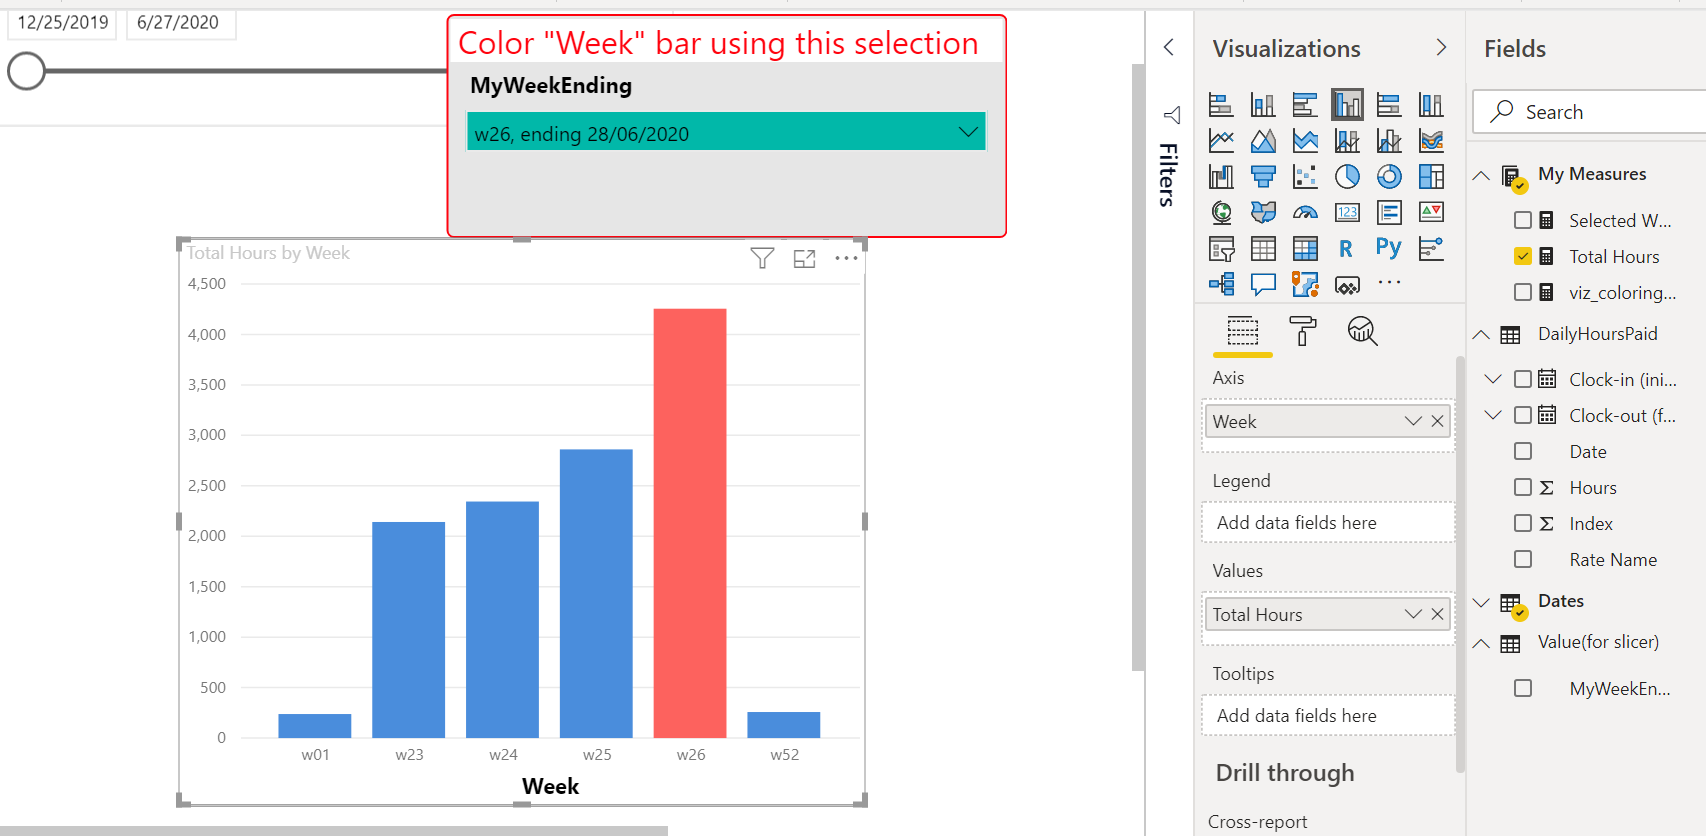
- You can create a table with 1 column i.e MyWeekEnding and do not connect it.
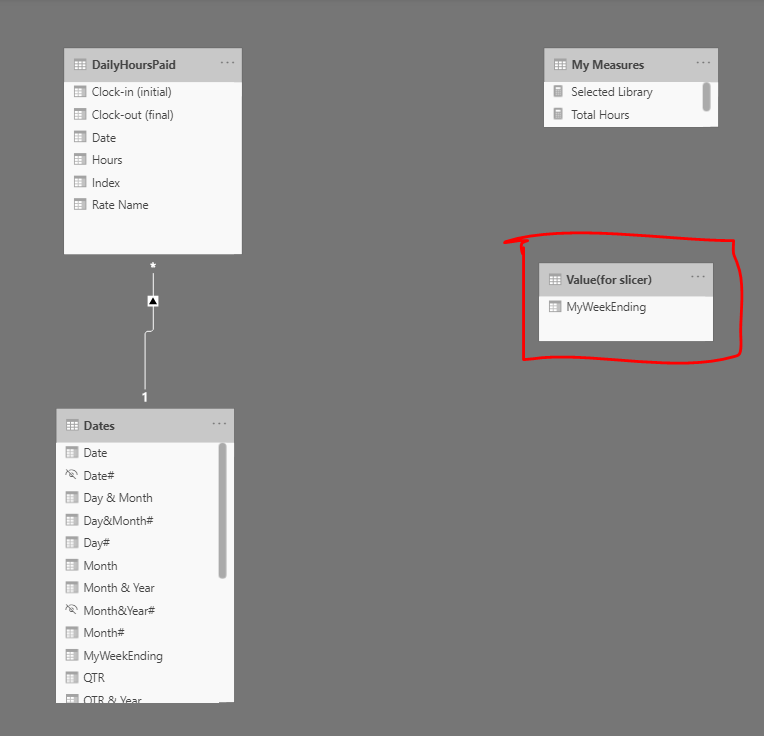
- Then create measure as below,
Selected Library = IF(MIN(Dates[MyWeekEnding]) = SELECTEDVALUE('Value(for slicer)'[MyWeekEnding]), 1)
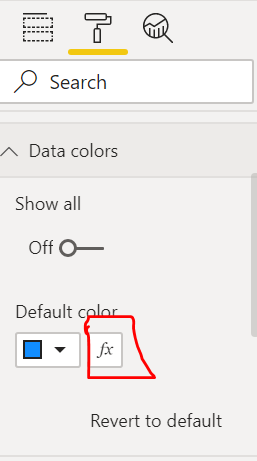
- Then do color formatting as below:
a. With bar table selected goto format:
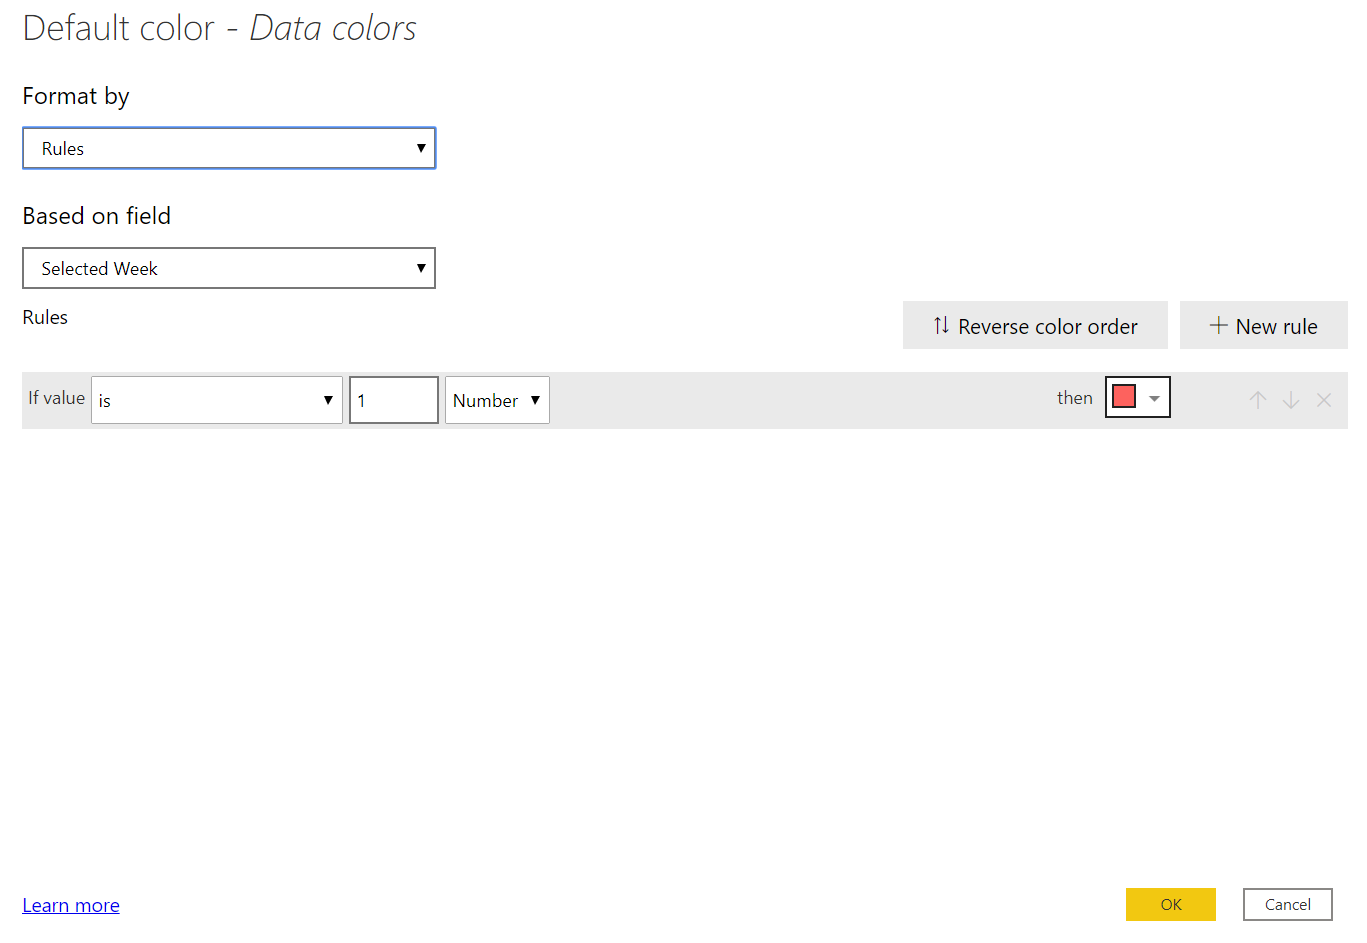
b. Then format as shown below.
- And change your slicer with new created table.
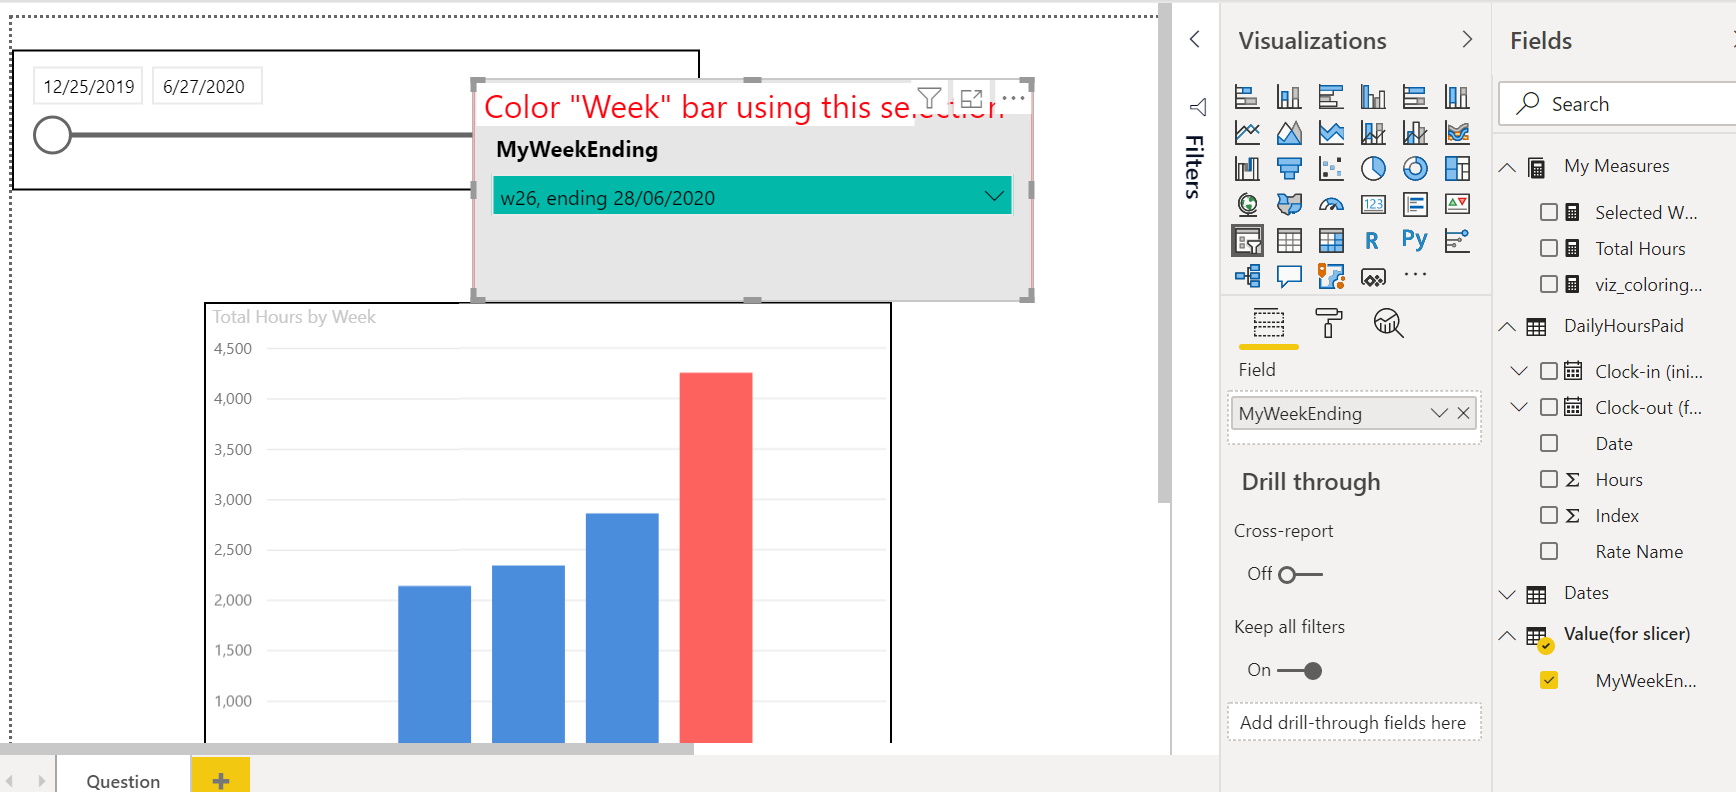
Below will show you week 26 as selected in red, change the color as per your choice.
Sorry I can’t upload pbix file as i used my office system.