Hi All
I have been using Sam’s course on Time-Based Cohort Analysis to create a dashboards.
I seem to be stuck on the DEMO tab of the course ie the 48.52 minutes
I have created 3 measures - Churned Customers, Churning % and Unique customers
However when I move these 3 new measures created to the Matrix dashboard, I can only view 1 line and not all lines. This is the line that relates to Month&Year.
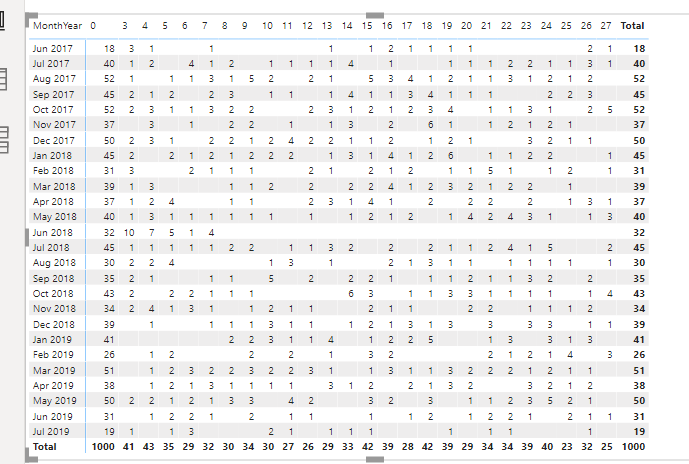
I have the following information in the Rows, Columns & Values of the Matrix
Rows = Cohort MonthYear
Columns = Periods
Values = Churned Customers
Please can you tell me why I am not able to view all the data in the Matrix ( its saved in Demo1) of the file. Hoping my explanation is clear.
Please find attached PBIX file.Customer Cohort Analysis.pbix (215.0 KB)
Many thanks