Hi Fellow Power BI Users -
In Your showcase of Churn Analysis https://www.youtube.com/watch?v=h9kRwgamLcw&t=29s
In B2B SaaS, there are two techniques that I feel are particularly important but not used widely enough – cohort analysis and multi-touch attribution analysis.
Est. reading time: 9 minutes
https://blog.usejournal.com/how-to-perform-cohort-analysis-calculate-customer-ltv-in-excel-80bfed785ec4
In B2B SaaS, there are two techniques that I feel are particularly important but not used widely enough – cohort analysis and multi-touch attribution analysis.
Est. reading time: 9 minutes
http://www.navida.eu/2015/07/22/analyzing-cohorts-with-power-bi-stock-market/
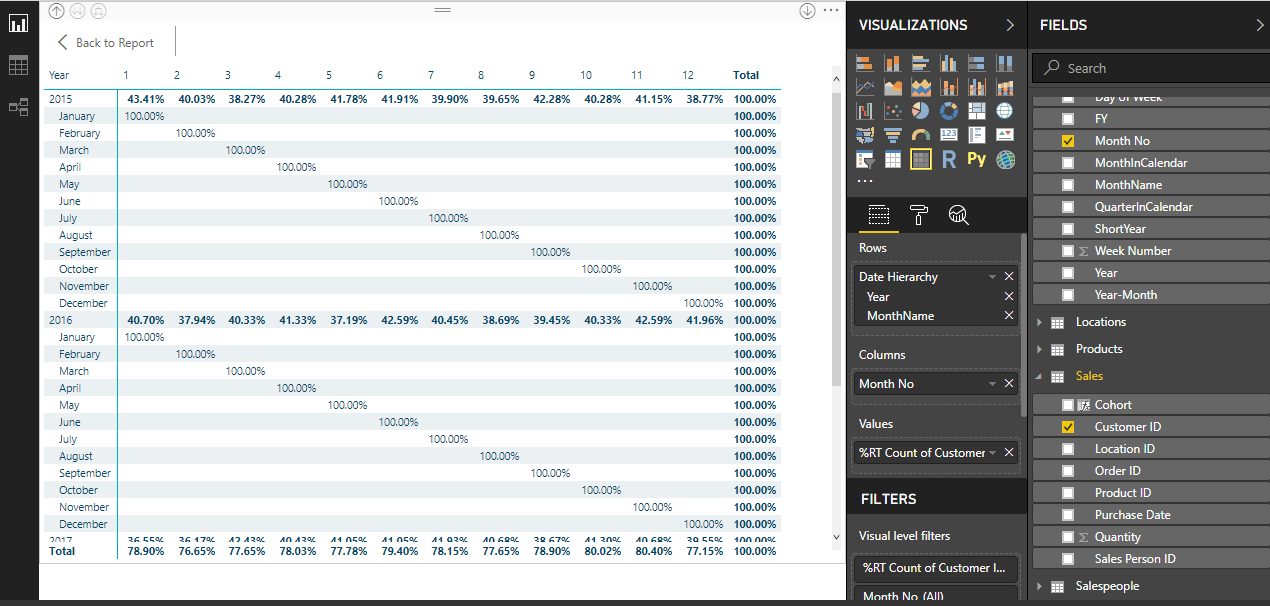
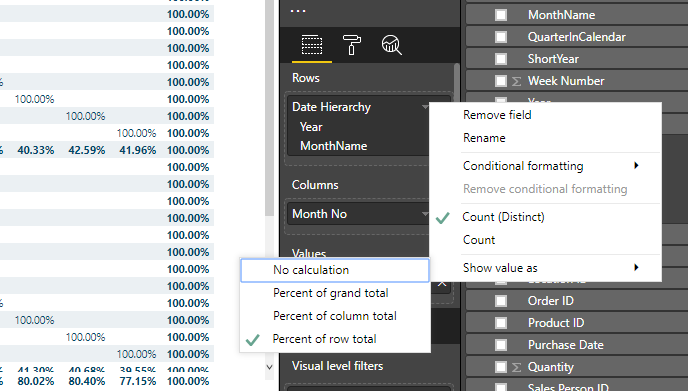
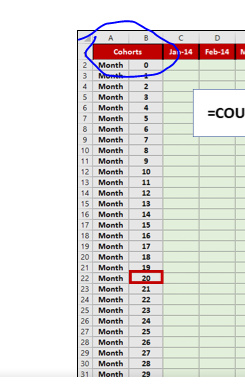
I tried to put it as a pivot table to calculate the retention rate as a cohort for each month by putting the Months Numbers as a column and the (Year & Month) as rows and customer count as value , but it does not give me accurate numbers on each month as shown in the pictures below:
What sort of changes shall we do in your showcase to calculate cohort analysis as it
I will look into this. But there’s a bit to it and I haven’t researched in depth for use in Power BI, so will require some time. Thanks
For the total customers I created the measure
I created the following calculated column:
For the cohort I made it like this:
Cohort = IF(day(Sales[Purchase Date]<20),DATE(YEAR(Sales[Purchase Date]),MONTH(Sales[Purchase Date]),1),DATE(YEAR(Sales[Purchase Date]),MONTH(Sales[Purchase Date])+1,1))

Y&M = VALUE (
    YEAR ( Sales[Cohort]) & "0"
        & MONTH ( Sales[Cohort] )
)

RankInvoiceYear&Month =
RANKX (
    FILTER (
        Sales,
        EARLIER ( Sales[Cohort] ) = Sales[Cohort]
    ),
  // Sales[Cohort],
   Sales[Purchase Date],
 // Sales[Y&M],
    ,
    ASC,
    DENSE
)
But I got wrong results
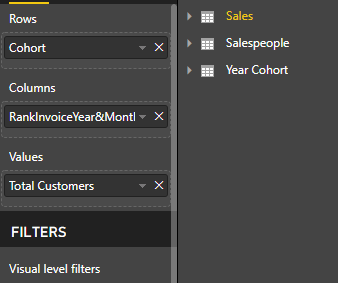
The setup is
I sent you the file by email , Can you guide about what is missing?
Can you add the file here.
I can’t see it on email anyway, but you can add them to the post here.
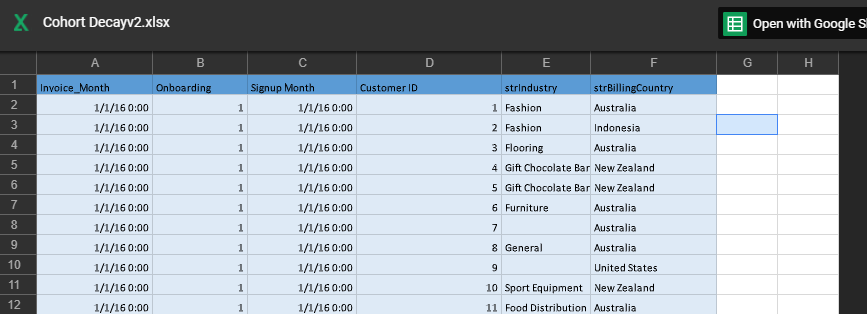
Customer attrition.pbix (497.1 KB)
Thank You Sam , The homework is on (Page 5).
Ok more detail is required here.
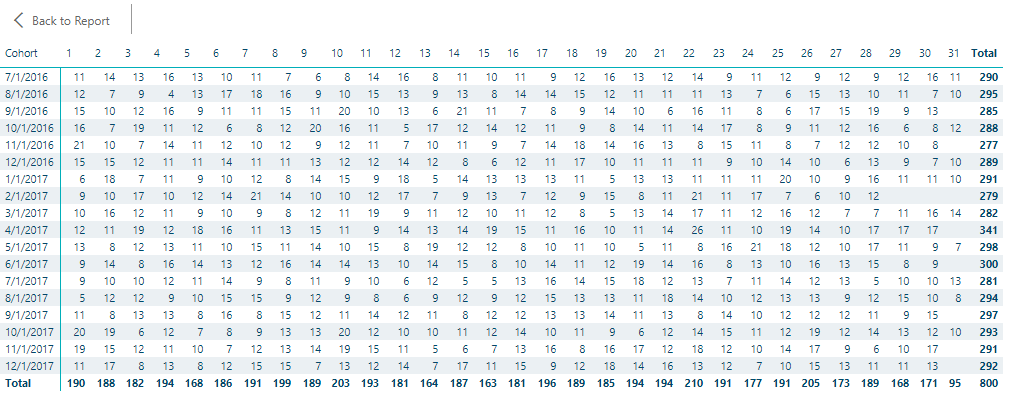
The reason why you are getting results like the below (I’ve played around with a few things) is because your ‘cohort’ groups are just each month.
From my understanding and from reviewing the articles you’ve posted you need to be able to group by something to great the ‘cohort’
Grouping by month, or any time frame doesn’t really make sense because you already have that filter.
For example here, the cohort groups are determined by how long a customer subscribed to the product.
These doesn’t really relate to the data set you are using. It’s just a different type of data.
Again this data is different
So really the question is what type of cohort are you attempting to create here?
I’ve mocked up an example from this data set here.
But you’ll see that there is an identifiable cohort that can be align to the dataset
AttachedCohort Analysis Example.pbix (80.7 KB)
For the file I’m already have it and I know it have a sign up date for the customer , In our case there is no Is that means we cannot implement it in our data?
Well you have to group the data somehow. That could be completed in a few ways. Just depends what you are looking for.