Cohort Analysis

I know you have a future training where you planned to go into greater detail but I am just trying to get the basis of a couple of the formulas for a Cohort Analysis I need to complete. I do have a table with the periods and the min and max days. Doing this will help me calculate the retention rate of our students especially since they are adult students who go in and out of cohorts.

Below are the formulas I have so far based on my specific scenario:
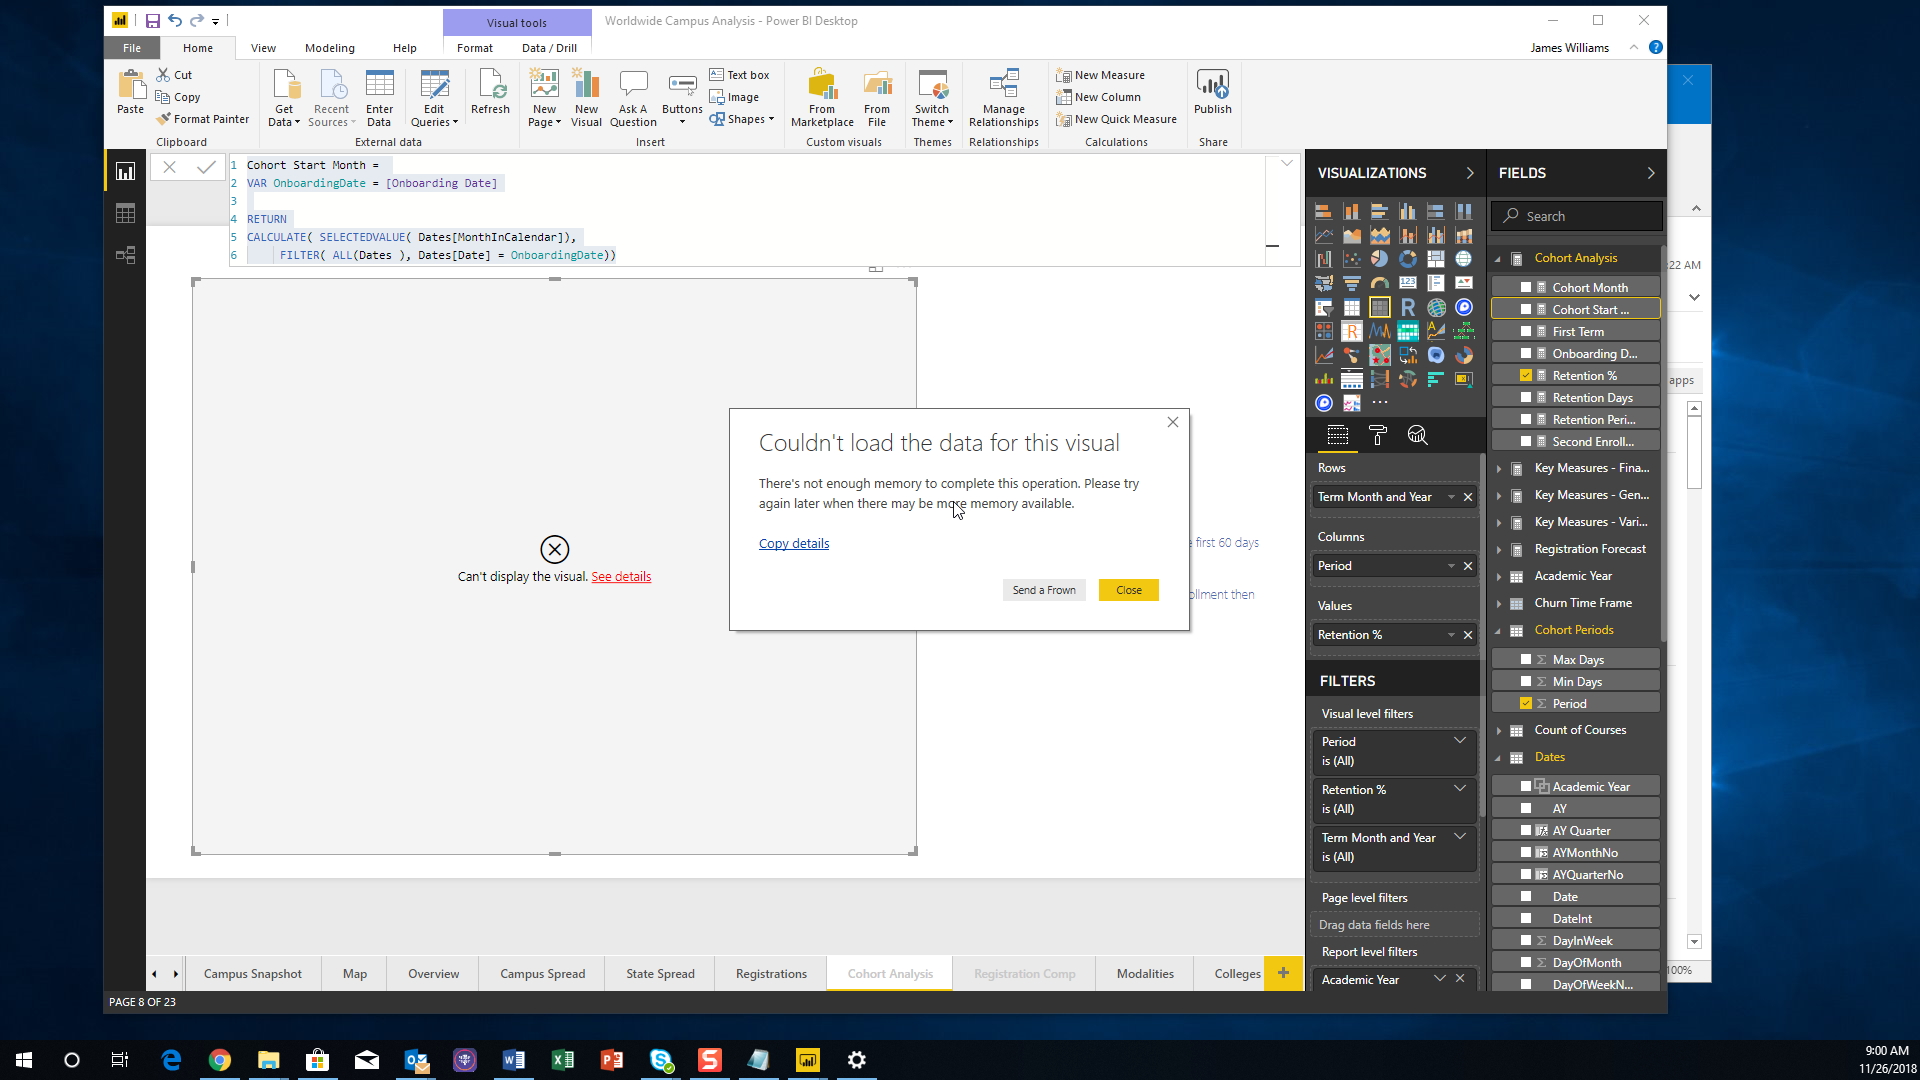
Cohort Month

Cohort Month =
VAR FirstEnrolled = [First Term]
RETURN
CALCULATE( SELECTEDVALUE(Dates[MonthInCalendar]),
FILTER(ALL(Dates), Dates[Date] = FirstEnrolled))

First Term

First Term = MIN( 'WW Registrations'[Session Begin Date])

Second Enrollment Date

Second Enrollment Date = 
    CALCULATE( MIN( 'WW Registrations'[Session Begin Date]), 
         FILTER( ALL( 'WW Registrations'), 'WW Registrations'[Session Begin Date] > [Onboarding Date]),
              VALUES( 'WW Students'[Student ID]))

Retention Days

Retention Days = 
VALUE( [Second Enrollment Date]) - VALUE( [Onboarding Date])

The formula’s I don’t know are as follows:

Onboarding Date - What specifically is this based on? Would I use the date they first became a student/customer? Is this somehow related to the Join Date?

After that I need to do the Retention %, Retention Days, and Retention Period.

I have been waiting for a good video to introduce Cohort Analysis I just couldn’t find one.

Ok let’s just wait till the session tomorrow. I will be speaking about this very technique for an hour or so. You will learn pretty much everything you need to learn around this concept during that workshop.

See you then!

https://enterprisedna.co/november-2018-learning-summit-registration-page/

I ended up having to catch the recordings. I completed the Learning Summit on Cohort Analysis. My only problem is I guess I have way too much data because the visual will not load before I get the below. I have even limited the amount of data down to just one year but for me thats still 88,000 rows of registrations (sales) and 23,000 rows of students (customers).

Any thoughts?

Yes there’s a lot of computation going on here, but that’s just the reality with these formulas. There’s a lot to compare and compute.

Potentially look at completing some pre aggregation somewhere. Can you aggregate this students up somehow based on similarities and then not have to iterate over so many. Or just take a subset of customer and average out the results.

This is really the only advice I have at the moment. It’s a tough one.

In terms of aggregating up do you mean using something like gender or age group? Also, in terms of pre-aggregating somewhere would doing some of it on the Query Editor Side make any difference?

Also, can I create more Cohort Periods int he table if the 30 day increments are too small for my specific use case? Does that eat up resources if I want to keep the 12 periods and just add an additional 24 onto them?

Also, I noted that you use the individual’s name in the formula I didn’t because the names are not unique, does that matter? I use their unique student ID number instead.

Below are all of my formula’s:

First Enrolled Term Date

First Term = MIN( 'WW Registrations'[Session Begin Date])

Second Enrollment Date

Second Enrollment Date = 
CALCULATE( MIN( 'WW Registrations'[Session Begin Date]), 
     FILTER( ALL( 'WW Registrations'), 'WW Registrations'[Session Begin Date] > [Onboarding Date]),
          VALUES( 'WW Students'[Student ID]))

Cohort Month

Cohort Month =
VAR FirstEnrolled = [First Term]

RETURN
CALCULATE( SELECTEDVALUE(Dates[MonthInCalendar]),
FILTER(ALL(Dates), Dates[Date] = FirstEnrolled))

Onboarding Date

Onboarding Date =

CALCULATE([First Term], ALL('WW Registrations'), VALUES('WW Students'[Student ID]))

Cohort Start Month

Cohort Start Month =
VAR OnboardingDate = [Onboarding Date]

RETURN
CALCULATE( SELECTEDVALUE( Dates[MonthInCalendar]),
FILTER( ALL(Dates ), Dates[Date] = OnboardingDate))

Retention Period

Retention Period =
    VAR StudentDimension = VALUES( 'WW Students'[Student ID] )

    RETURN
    IF( SELECTEDVALUE( 'Cohort Periods'[Period] ) = 0, [Unique Registered Student],
    CALCULATE(
        CALCULATE( [Unique Registered Student],
        FILTER( StudentDimension, 
        COUNTROWS(
            FILTER( 'Cohort Periods',
            [Retention Days] > 'Cohort Periods'[Min Days] && [Retention Days] <= 'Cohort Periods'[Max Days] ) ) > 0 ) ),
            TREATAS( VALUES( Dates[MonthInCalendar]), 'WW Students'[First Enrolled Month Cohort])))

Retention Days

Retention Days =
VALUE( [Second Enrollment Date]) - VALUE( [Onboarding Date])

Retention %

Retention % = 
CALCULATE(
    DIVIDE( [Retention Period], [Unique Registered Student], 0),
    TREATAS( VALUES( Dates[MonthInCalendar]), 'WW Students'[First Enrolled Month Cohort]))

Taking a subset of the data is an option to the average out.

If it’s really slow the main reason it likely because you are iterating through something many many times.

Within the formula your likely iterating through thousands of students in every calculation.

That a lot of iterating if this is over many years.

Think…how can you reduce the number of iterations within each calculations. That’s where you’ll see huge performance improvement, if you can optimize that somehow.

One thing to also do it get the Cohort Month into the students table, and use that column within your matrix.
This will place a filter on the correct list of students for every cohort. That’s one way to optimize this.

To me the cohort periods is unlikely the issue. That table is quite small overall. It’s the number of students you need to individual run through that table that is the issue.

Hi Sam Unfortientlely I couldn’t attend the webinar can you give me the link for the recording including the showcase files?

See here

Thak you Sam , I watched the video but what about the resources?

They are in the same module