Cohort Analysis Show Average for each Cohort

Hi

I’ve created a cohort analysis table for a monthly subscription model. Clicking the slicer buttons will show retained, churned, average sales etc.

I now want to get the average of the populated cells for each month into the subscription and then create a bar chart.

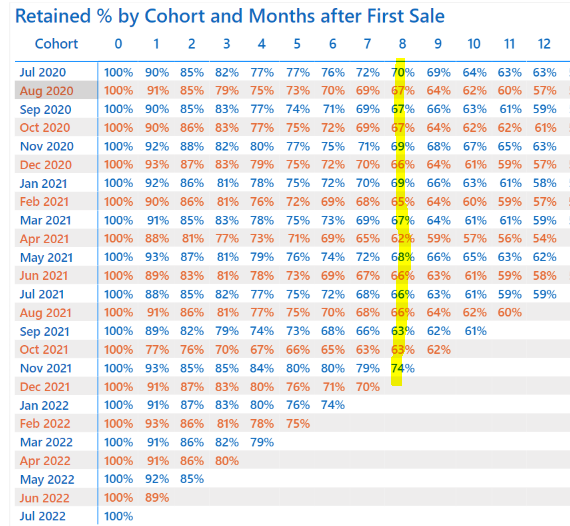
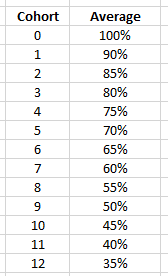
For example, for Retained % I want to end up with a table like the below. Average is adding all the populated cells for that month and then dividing by the number of populated cells.

image

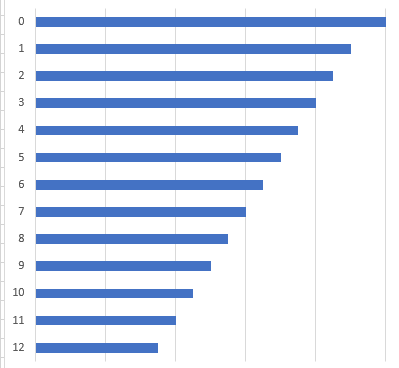
Once I have the table my intention is then to create a bar chart (the example below is just a rough approximation done in Excel.)

image

My working file is attached.

Any thoughts on how the averages for each month could be calculated would be much appreciated.

Thanks

Cohort sample.pbix (1001.4 KB)

Hi @KieftyKids! We noticed that your inquiry was left unsolved for quite some time now.

Looks like your inquiry was out of the experts and users’ bounds.

We strive to answer ALL inquiries in the forum. However, if you are sure that you provided all pertinent context to your concerns and read how to use the forum more effectively and still find your question unanswered, you can check out tutorials to learn this yourself as your membership also comes with relevant resources that may help you with your Power BI education.

While our users and experts do as much as reasonable to help you with your inquiries, not all concerns can be attended to especially if there are some learnings to be done. Thank you!