Cohort Analysis Data Model Design Need Your Advise

Hi,
One of the interesting topics to me is the cohort analysis Showcase, I have some questions need your advice for one of my projects related to cohort analysis, My client has a data structure for (Sales orders, State Regions, Regions, Customer, and Products) around 90% Similar as cohort analysis showcase with some distinction in the following areas:

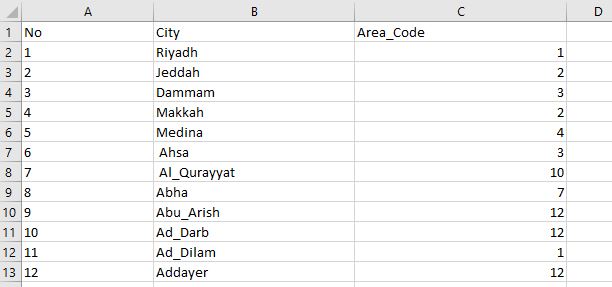
  1. The customer Table In addition to the Primary Unique Key have (Region No) as foreign key and Longitude and Latitude for customer address location as shown in the below screenshot:

Customer

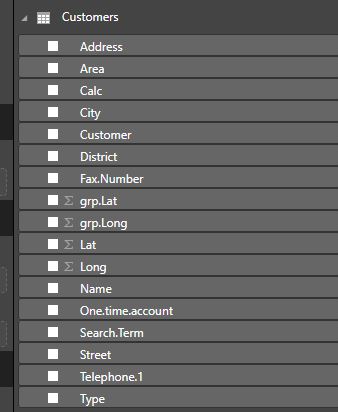
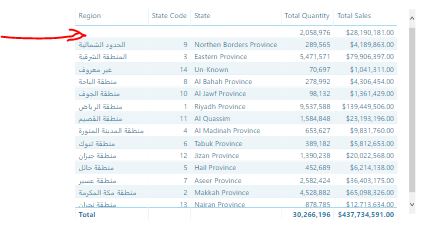
  1. The Regions consists of Cities name with the Primary Unique Key and state No as shown in the below screenshot:
    City

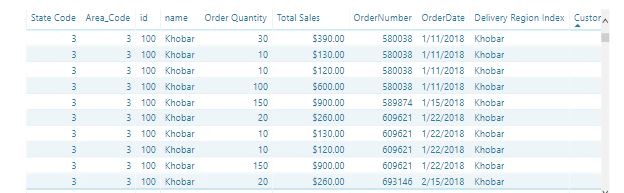
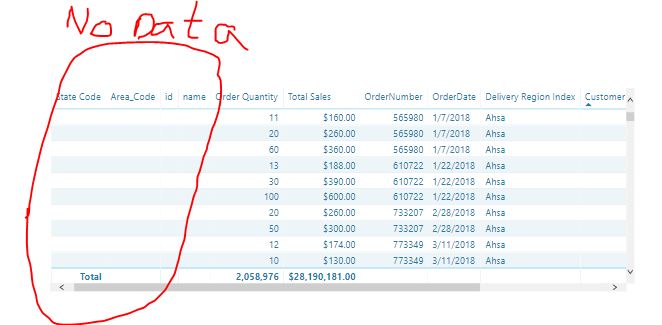
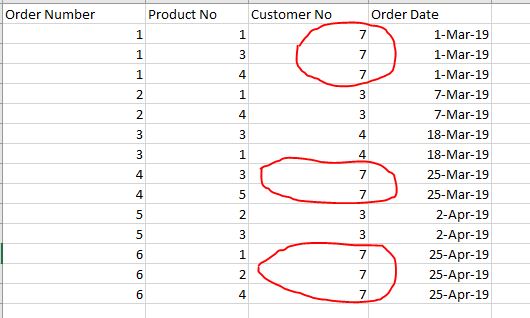
  2. The Sales orders data have Composite Unique key for the Columns (Order No, Customer No, and Product No) as it is illustrated in the below screenshot:
    Order%20Data

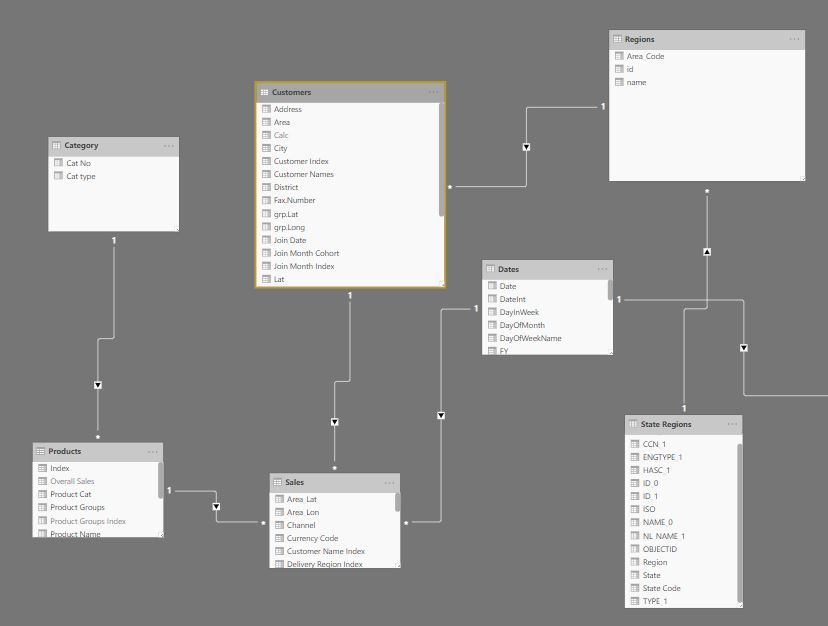
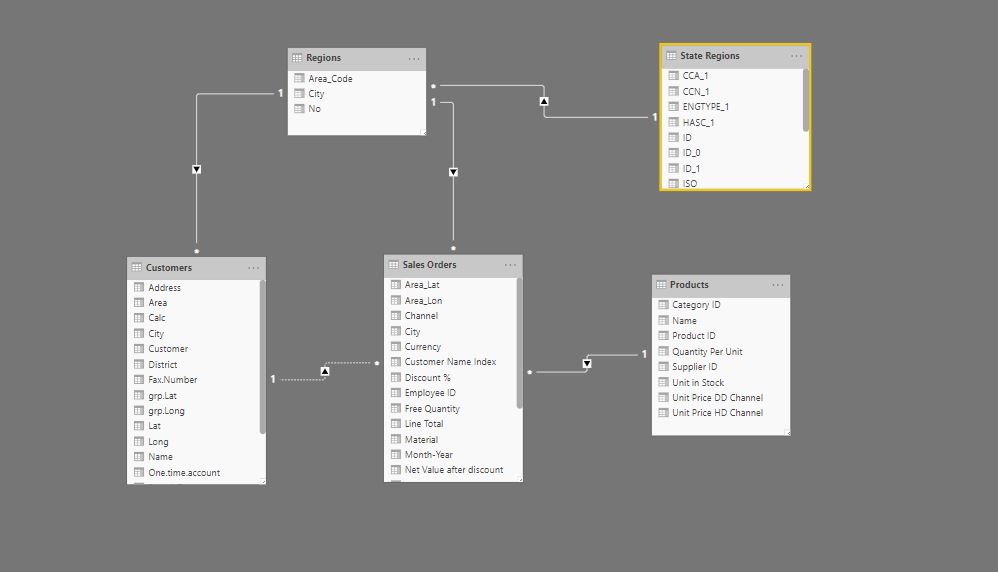
4)The primary relationship model diagram as shown in the following screenshot:

Aiming to gain advantages from your valuable resource showcase and to invest my time (not inventing the wheel) I’m trying to make my Data Model aligned with your showcase to minimize working efforts on my cohort analysis case, Based on the above introduction in sections (1-4) I have the following questions:

Q-1 Refer to Point (4) What is the more appropriate case to make (1: M) relationship on either one of these tables (City Or Customer) from one side and (Sales Order) in another side fitting with your (Measures) Modelling?

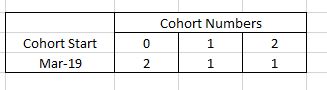
Q-2 The most important process in cohort analysis is counting the Customers frequency of purchasing On My Case In (3) for customer 7 details he purchased Products( 1,3,4) On 1st of March 2019, and on 25th March 2019 he purchased products (3,5), then he purchased (1,2,4) on 25th of March so if we calculate the total no of orders he purchase it would be 2 orders(times) in March and 1 time(order) in April, so his cohort details would be :
Cohort%20Customer%207

In the EDNA showcase, I found each order purchased with one customer like the case of customer
247 :
EDNA%20Order%20Data

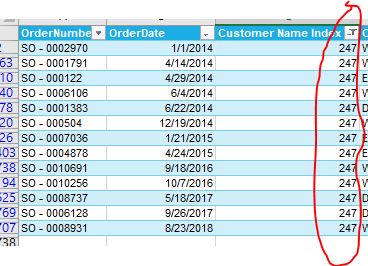
Is there a difference in the process of counting the purchases of the customer based on the design difference between sales order of my case and EDNA Showcase? if yes what sort of changes shall I do?

Q1. I honestly don’t think you need to change anything in your model. One to many relationships are fine to me.

Your model looks like it’s setup correctly already to me. I would just place the tables in different places.

Check out this video here for my recommendations on this.

Q2.

I think you need to decide first what type of cohort analysis you are completing. The one showcased here is time based.

But in your description you’re talking about something different. You’re actually describing grouping based on purchasing.

I understand these are very similar and in many ways there are a lot of similarities, but also a couple of differences.

All you need to do here is work out the start cohort, and I would place this column into the customer table, just like I have in the example.

From here though you then create the grouping based on purchases.

There’s no way to recognize time here though, as in when the purchases where made based on how you’ve set this up.

You need to choose. Do you want to group by purchases or do you want to group by when the purchases were made. I don’t believe you can have both.

Thanks
Sam

Thank You so much for this valuable information you provide , Actually I’m focusing on grouping, I need to calculate the retention rate of customers who purchased through orders(Not particular product but all of the product at the store) to do assessment for customers loyalty in returning to purchase, I considered the Cohort strategy based on your Video here:

Now I Build the RelationShip Model As you recommend in your last replay(Region as the foreign key inside the customers’ table) and The customers No as (Foreign key inside the sales):

I have extra Questions based on your last replays :

Q-3 I want to gain Extra Advantages from your second cohort type (Time Based) for the Cohort Grouping, This advantage is important in getting finding for the Loyal Customers when they know when is their exit time (The more the number is the more he(the customer) was loyal) to bring him back again to repurchase, e.g.: We consider the Customer lost if he not buying from more than (2) Months (Like your customer churn analysis http://portal.enterprisedna.co/courses/305959/lectures/6727130), I don’t have on my data a column indicating the cancelation of the customer to know the exit period after knowing the exit date (Exit Date) :
Exit%20Period

Is it possible to know the exit date by considering the onboarding date without (Interaction column) by adding the Period considered the customer lost like this
CustomerLost=60 # (60 Days if the customer does not purchase will be considered lost)

Exit Date = 
CALCULATE( MIN( 'Website Data'[LogIn Date] ),
    FILTER( ALL( 'Website Data' ), 'Website Data'[LogIn Date] > [Onboarding Date] ),
       [lostCustomer]=1,
            VALUES( Customers[Customer Names] ) )  ?

Q-4 (Refer Back to the Relational Model Diagram) I’m Trying to summerise the Total sales for each state in the (State Region Table), It calculates the Total Sales smoothly for each State But the problem it gives a calculated value for (Blank Raw) like the following picture:
Relationship%20Diagram%20Problem_Table%20Blank

I checked the filtration In the Table custom visual found (Blank) inside the filtration:
Province%20Blank

I’m sure 100% that:
1-No Empty(Blank) Raw (Or Id Or name) in the State Region Table, Same thing in the (Region, Customers, and Sales) Tables.

2-No Any error for the Relationships (Check the diagram above).
3-The Total No Of Customers in Customers Table (18K) customers around (3K) of them not purchasing (No transactions for them in Sales Table).
4-When I click On Any Raw on the State Table custom visual for Non-Blank Row
Province%20Highlight%20Press

For the purpose of tracing You may note the State code and area code (Foreign key) is displayed in the below image
Details%20With%20Code%20Area

5–When I click On the blank Raw
Province%20Highlight%20On%20Null%20Press

For the purpose of tracing You may note the State code and area code (Foreign key) is displayed a blank in the below Image
Details%20Without%20No%20Code%20Area
6-The total sales calculation is correct.

Where does this Blank Row come from? Why it happens?

Note: If you want to check the (Pbix) file I can share it with you through the email because the Data is confidential, but you can share the solution answers with the members.

Thank you,

Appreciate all the this information but honestly I’m very confused at what your attempting to do here. It’s almost too complicated and too much information.

Can you simplify this and maybe add a demo file of the exact scenario. This would be the best to get assistance.

Thanks
Sam

I’m Sorry If I’m Get Confused you Lets start by The More Priority Question With Regards the design of the relational Model (Q-4) I had a row In the (State Table) When I display the total sales for each state in the (State Region Table) It gives me a Blank Raw with calculated (Sales) as shown in the below screen-shot:

Relationship%20Diagram%20Problem_Table%20Blank

I’m sure there is no foreign key with (Blank) value in the sales table
The total sales DAX formula as the following:

Total Sales =
SUMX( Sales, Sales[Line Total] )

Why this Blank row displayed in the Table?

Note: If you want me to share the (pbix) file with you for check, I can send you it through (email) cuz it is confidential and I can’t make it Public to everyone but of course we can share the answer of the problem
with everyone.

If the row is blank here it will be something to do with your data not exactly matching up between your tables. There is most likely something in your fact table that doesn’t have an reference in your lookup table which is providing the context for your results.

I would do a quick audit of what rows aren’t matching up.

Sam

Ok Soon I’ll share with you the (pbix) file.
Please Note that I shared it through my gmail account (my second email)==> MAAbdullah47@gmail.com

I share it to your email : sam.mckay@enterprisedna.co.nz
You will find the details of the tables on report tab (Page 2).

Please don’t send the file to me.

You must mock up a demo file and add it here if you need assistance. All support happens through the forum.

Thanks

Can you guide me How I mock up the file?

Please review here before asking any further questions on the forum. Thanks

https://forum.enterprisedna.co/t/rules-and-tips-for-asking-support-questions-on-the-forum/30

Ok here is the link I mocked up the data by changing the label of the product into sequential products.

Please refer to Tab (Page 2) int the report , The Blank row showed in the screen shot below:
Mokup

Thank You, For this question I solved it , It is related into a space inside the Region Name leading space in the master table (Region) while the Region name in the detailed table (Customers) not have any leading space in their names.

Now Back to my Previous Questions (Q-3) (I hope I write my question in a way that you understand it) :

Back to churn analysis for lost customers: https://www.youtube.com/watch?v=cfDyNPQIJtA
Basically my cohort analysis is for (grouping) , but Also I need to gain advantage from the (Time based) cohort by replacing the flag of (cancel) column in (Time based) cohort with (lost customer) like the case of churn analysis considering the [lost customer]=1 , by doing this techniqe is it valid to gain both advantages of (Time based) & (Grouping) cohort techniqes?

Thank you

Thanks to the contributors of this post. Due to the length by which this post has been active, we are tagging it as Solved. For further questions related to this post, please make a new thread.