Hi,
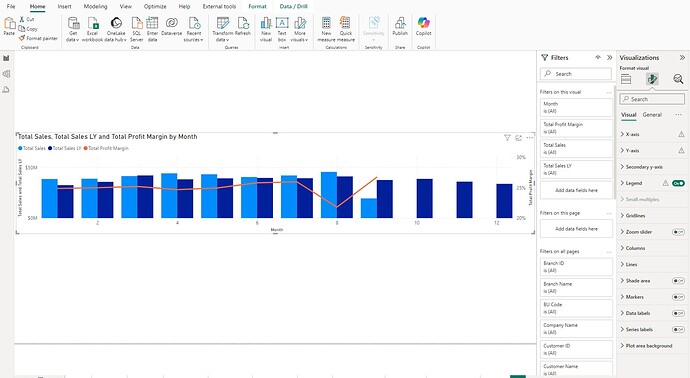
I’m trying to apply conditional formatting to a clustered bar chart, but I’m having trouble figuring out how to do it. The goal is to format the bars so that Total Sales shows in red when it is lower than Sales LY.
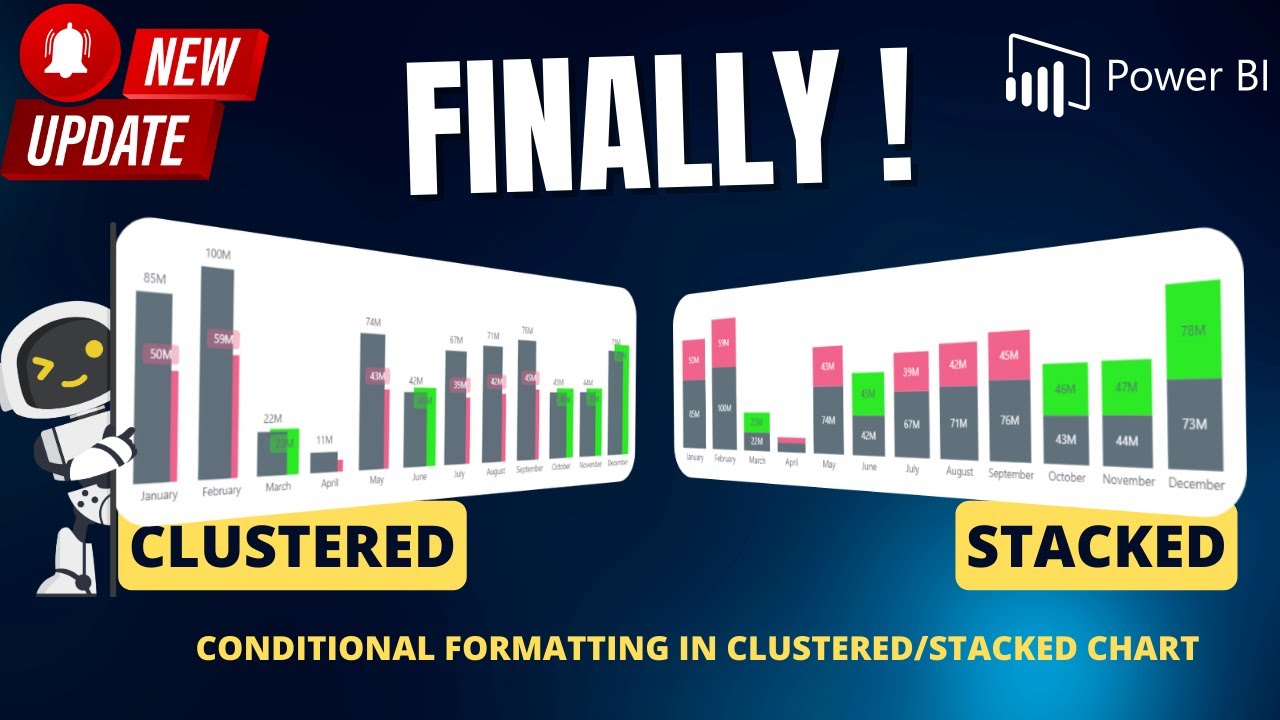
I’ve seen tutorials where some charts allow the fx button under Data Colors for single measures, but I can’t seem to find that option in my visual. Is it possible to apply conditional formatting directly in the Visual Format area for clustered bar charts?
I’ve also seen examples using DAX to create measures for conditional formatting, but I’m not sure how to apply that approach in my case. Any guidance or suggestions on how to get this working would be greatly appreciated!

