Hi Experts,
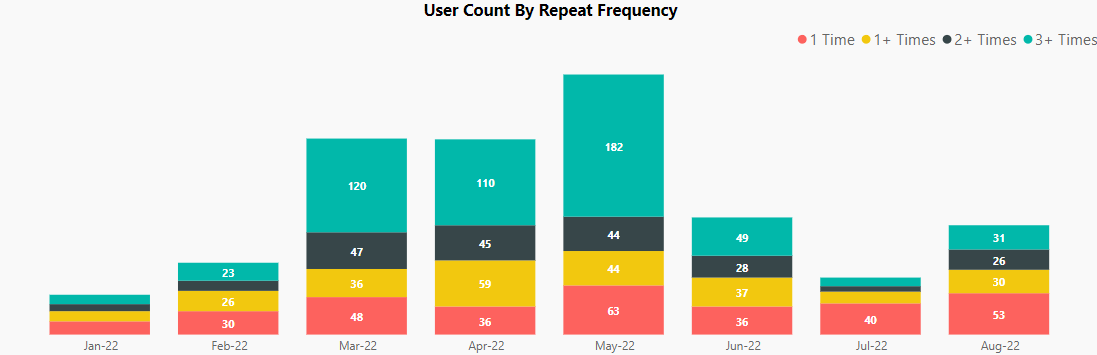
I’m trying to build below kind of visual as an output. but visual setting is not taking measure as Legend.
Basically, I was created a conditional measure based on below condition and trying to add this measure as visual Legend.
If Users had only one Unique session Id in a specified date range, then 1 Time
If Users had Two Unique Session Id’s in a specified date range, then 1+ Times
If Users had Three Unique Session Id’s in a specified date range, then 2+ Times
If Users had More than Three Unique Session Id’s in a specified date range, then 3+ Times
And also if the user selects a date range from 15-Aug-2022 to 14-Sep-2022, the graph will still show two bars for each month, but the data must be filtered on the specified date range only.
Please check and let me know if you find any other solutions. I’ve attached a sample .pbix file for your convenience.
Sample_pbi.pbix (44.2 KB)
Regards,
Rommala
Hi Team, Any suggestion on below requirement?
This is a case where a disconnected table will really help you - a measure will only show as part of a chart legend in a case where you are charting two or more measures.
So in your case you would have the option to create multiple measures (one each for 1 Time, 1+ Times, 2+ Times, 3+ Times) - OR you can create a disconnected table, and a simple measure for your chart.
I setup the disconnected table as follows:
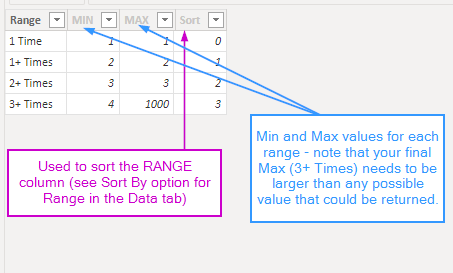
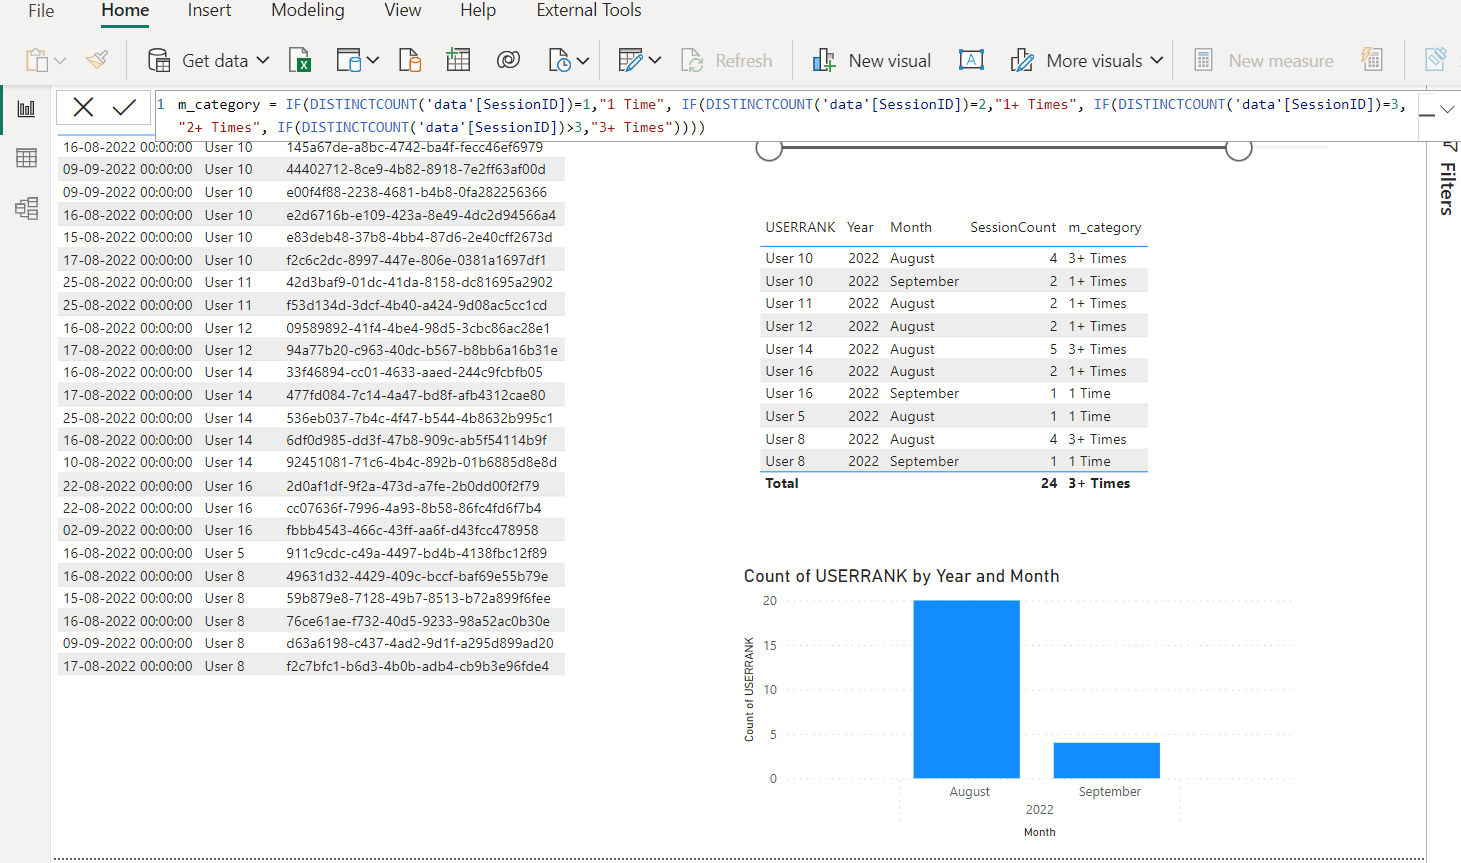
For your table visual, I removed the m_category measure, and created the following:
eDNA Solution - Session Count (w Range) =
VAR _MinRange = MIN( 'Range Table'[MIN] )
VAR _MaxRange = MAX( 'Range Table'[MAX] )
RETURN
    IF( [SessionCount] >= _MinRange && [SessionCount] <= _MaxRange,
        [SessionCount],
        BLANK() )
and I added Range (from the new table) to your table visual
For your chart, I created this measure (note that it relies on the measure above)
eDNA Solution - Unique Count =
COUNTX( VALUES( data[USERRANK] ), [eDNA Solution - Session Count (w Range)] )
and I added the Range column as the chart legend
I noticed that your report does not have any fact tables (not even a calendar table), but I’m assuming that this was only so you could provide a simple model for the forum sample. 
Solution File is attached:
eDNA Solution - using Disconnected Table as Chart Legend.pbix (51.5 KB)
@Heather, I really thank for the quick help and all the work and effort.
Yes, you are correct, I was sent simple model for the forum sample.
Regards,
@mrommala
1 Like