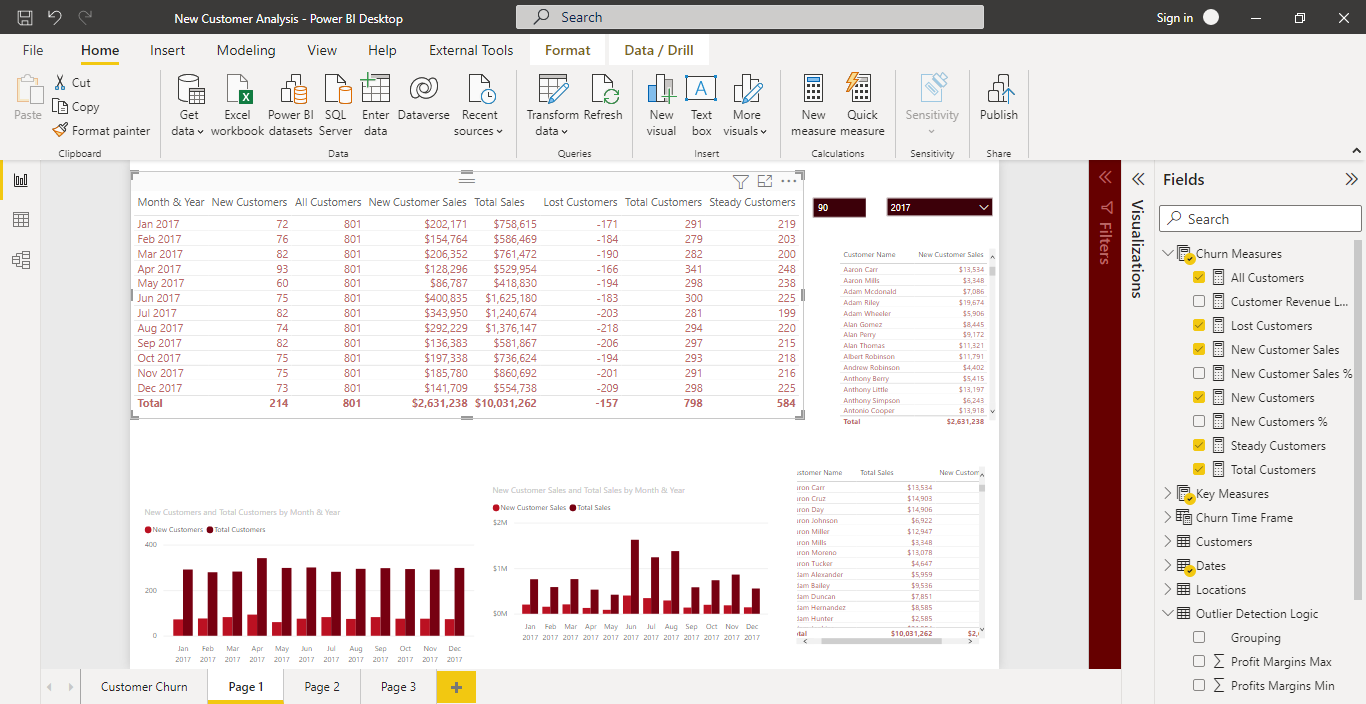
the attached screenshot for the churning customers analysis ,
i know how is the code made and i understand the logic but what i don’t understand is the “Totals” , where it does come from how it have been calculated ??
Thanks,
Abeer
Hi ,
it didn’t solve it , what i ask about for example the new customers are 214 how it has calculated to be 214 in the year 2017 as it shown in the screenshot.
Abeer
Do you have the file itself? It could be set up to count the total amount of distinct customers thru the entire year. Without knowing what the process is as far as what is being calculated and not seeing the file I am not sure you are able to determine exactly why. It could be any of the below metrics was used.
@Abeer I looked at your file. I’ve done the same analysis for my work. It is calculating the total customers by ID between those given dates in your DAX. Filter(ALL removes any context in your date selection. But your Churn Value Time Frame is set to 90
Churn Time Frame Value = SELECTEDVALUE(
‘Churn Time Frame’[Churn Time Frame], 90 )
As I put different values in like the past 120 days for new customers I get a small number. If I put 30 days for the churn time I get a larger number for new customers. Might want to look into that. I’ll dig around some more.
Hi @Abeer,
The 214 new customers for the year 2017 are calculated by obtaining the customers who have purchased throughout the year 2017 minus the customers who have purchased 90 days before 01/01/2017.
I have created the following tables to be able to see the result of this particular calculation:
Hi @Abeer,
In this case, all customers who purchased 90 days before 01/01/2017 have returned to purchase throughout the year 2017, so none of these customers have been lost.
so the 157 customers that have been lost in 2017 appears in totals
where comes from,
if this total refers to the customer lost during this year ??
Thanks
Hi @Abeer,
According to the calculation of the measure:
Lost Customers =
VAR CustomersPurchased = CALCULATETABLE( VALUES( Sales[Customer ID] ),
FILTER(ALL(Dates),
Dates[Date] > MIN( Dates[Date] ) - 365 &&
Dates[Date] <= MIN( Dates[Date] ) - [Churn Time Frame Value] ) )
VAR PriorCustomers = CALCULATETABLE( VALUES( Sales[Customer ID] ),
FILTER(ALL(Dates),
Dates[Date] > MAX( Dates[Date] ) - [Churn Time Frame Value] &&
Dates[Date] <= MAX( Dates[Date] ) ) )
RETURN
COUNTROWS( EXCEPT( CustomersPurchased, PriorCustomers ) ) * -1
It is calculating the lost customers as those who have bought in the period of one year before the start of the period (01/01/2017) and the end of the period (12/31/2017) minus the Churn Time Frame (90 days) and that are not among the customers who have bought from us in the last 90 days taking the end of the period (12/31/2017).
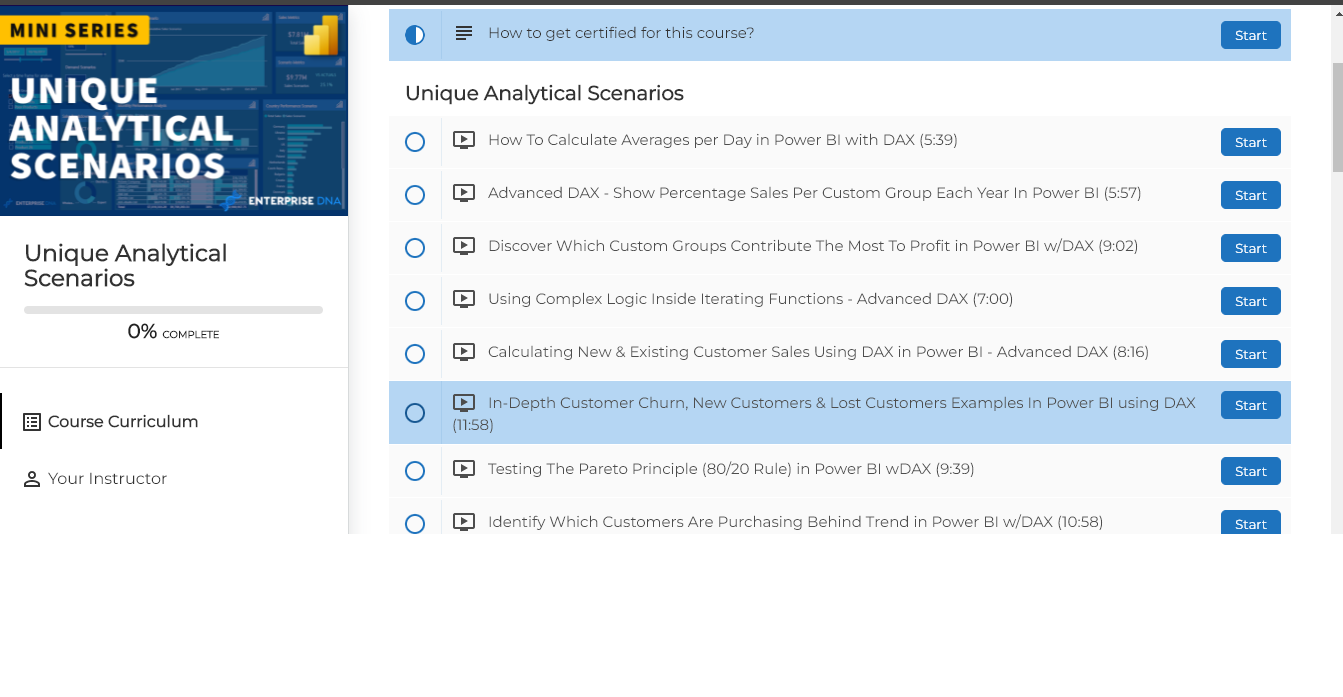
Where did you download the pbix file from? In the Unique Analitycal Scenarios course I can’t find that file, there is a different one.
I used the logic you told me but didn’t use min or max I used your first way for new customers but gave me different number for lost customers which is 211