I have been learning to use the new charticulator visual but a couple of days I go I started getting an error message and the visuals would not render in power bi desktop.
Error: dataset incomplete. Please specify all data fields
What am I missing? I have put in all the fields used in creating a simple bar chart but still the visual is not showing in power bi desktop.
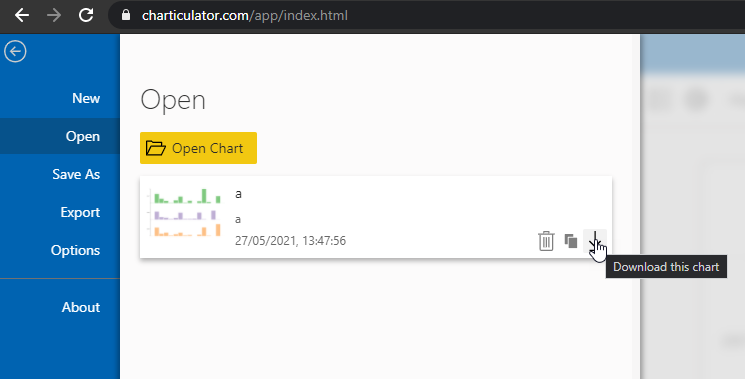
Kind of hard for anyone to advise without posting a sample file. Please post more information so that we can better help you with the issue at hand. Did you build the Charticulator on the website, or the new app that is available in The Desktop. The error message looks like one you would get from building from the website, but hard to tell without a sample file.
I’ll have a look, but I would suggest using the app that is available on the desktop version of Power BI. That error you got is most common with using the Charticulator website.
That error is most common when using the file from the website in Power BI, and the user did not add all of the required fields that were used when building the file on the website.
@JarrettM His visual shows a Primary Key field, are you aware of what that is? Since it is isolated from other fields it looks like there is some setting for creating a Primary Key.
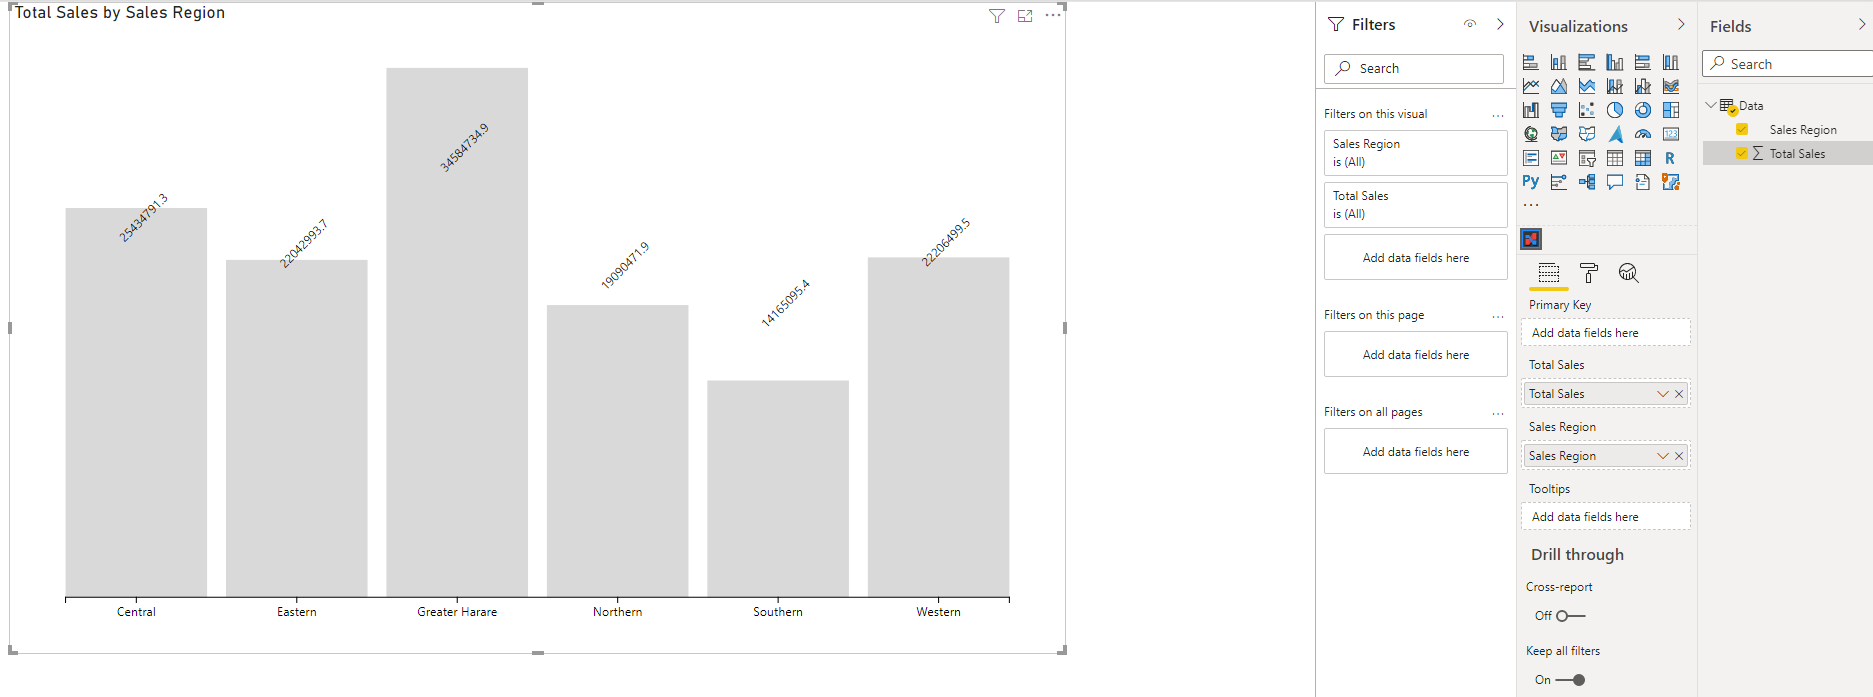
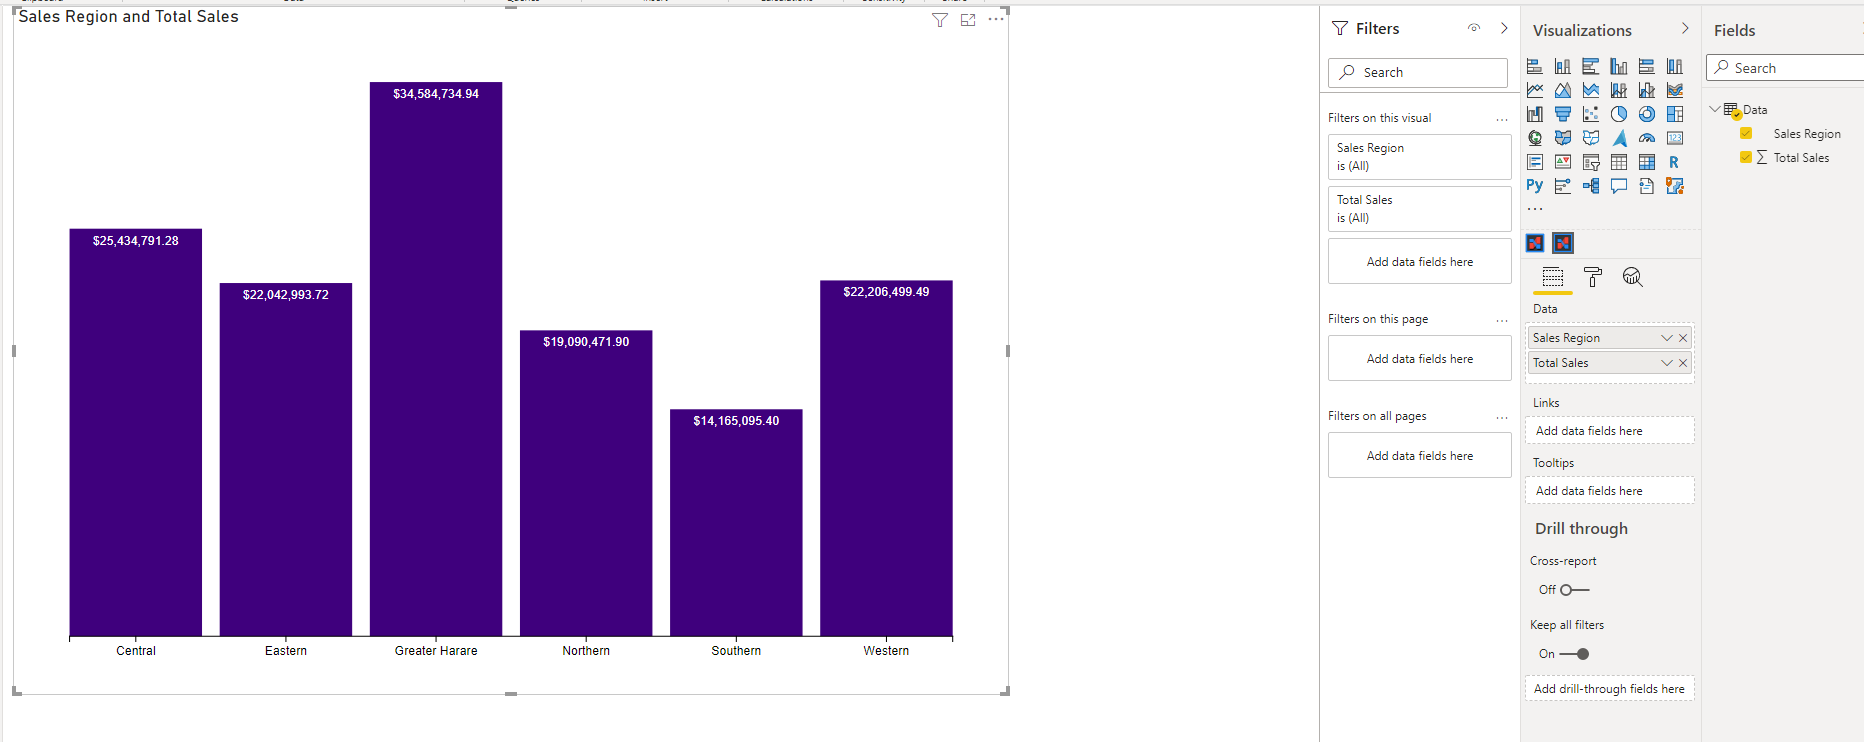
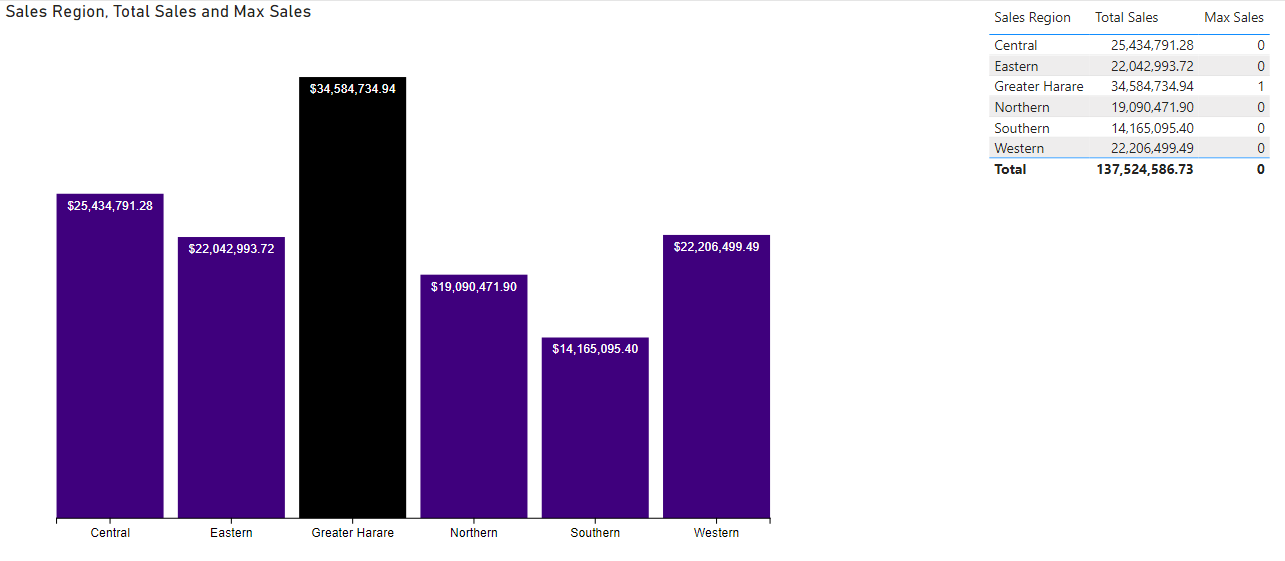
Working fine on my version I did. Don’t need primary key. You never posted your orginal PBIX file. Please post it and I’ll have a look. You posted the data and the pbiviz file, but no pbix file. I created a PBIX from scratch.
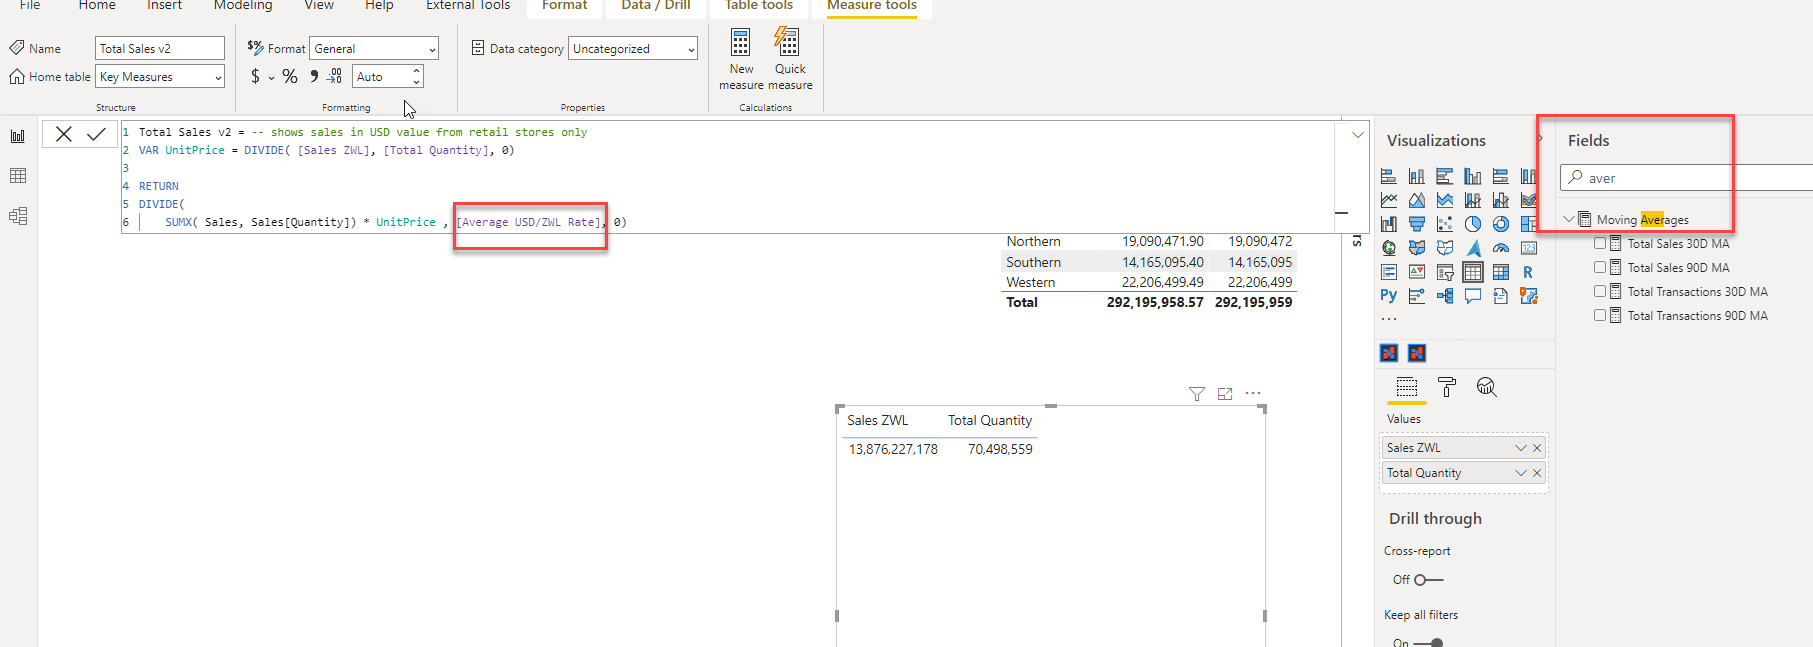
** The only thing that could be causing the error is the way you have your Total Sales column formatted in you pbix file. Post the pbix, and i’ll see if that is the issue **
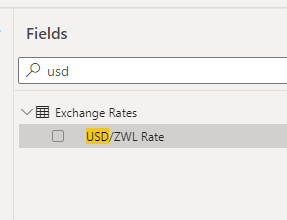
The issue is with your Total Sales measure. The Charticulator visual you shared & the one that is built into the desktop does NOT like that measure. I did some investigating into the measure, and cannot locate the “Average USD/ZWL Rate” measure. I see a measure for USD/ZWL Rate though?
** If that does not solve the issue, the only other option would be to send your PBIX to the Charticulator team at Microsoft. I sent one earlier this week with a similar issue, but have not heard anything back. Email is Charticulator@Microsoft.com
Thanks for that @JarrettM . I switched measures and tried the same chart using “Total Quantity” instead of the “Total Sales” measure and it worked well. Could be something in my sales measure, will look into it.
Oh yes, I hid the Average USD/ZWL rate in report view to reduce clutter. If you go to the data tab you can unhide the measure. But yeah, there’s definitely something not right with that calculation. Thanks again for the solution!