Chart x-axis displayed upon date range slicer

Hi everybody,
First of all, the forum is an amazing source of ideas/information, thank you all :slight_smile:

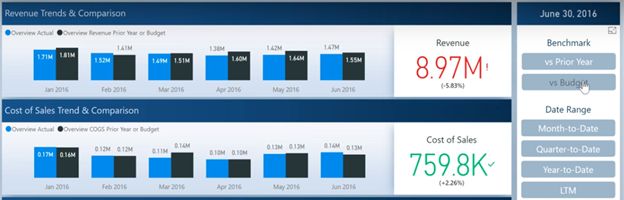
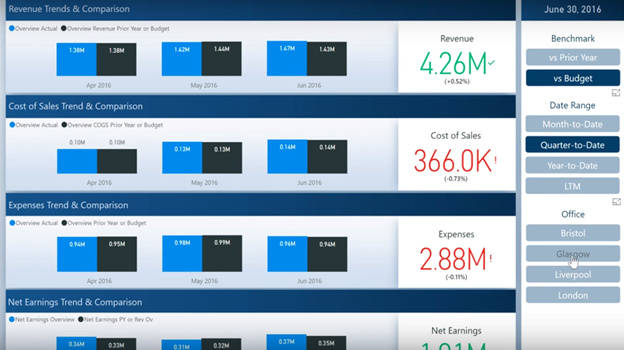
I would like to build a report with data to be expressed upon slicers as below example:

  • Benchmark to show “vs Prior Year” or “vs Budget” value upon slicer selection.
    I understand this is done through SELECTEDVALUE and SWITCH(TRUE formulas. I’m good with it.

  • Date Range to display the x-axis of the chart upon slicer selection
    It seems that by default chart is displaying in x-axis year-to-date month columns (in this report up to month of June) and when slicing by another date range e.g. “Quarter-to-Date” chart only displays in x-axis months of related quarter and the value is express per month… (separately) and not escalated as April=April Budget then May=Sum of April+May Budget then June=Sum of April+May+Jun Budget as would do the QTD formulas…

How would model and/or slicer be built to display x-axis this way with columns shown as per slicer and values per month and not “to-Date” ?

image

image

I would appreciate your kind support.
Best regards
Alexandre

@Alex7891,

Welcome to the forum! It is a fantastic community, and we’re glad to have you here.

Take a look at the following two videos, which I think will help address your requirement. They take different approaches to the same basic question, so you can see which approach might be more applicable to your particular situation.

If these don’t solve your problem, please post your PBIX file and we can work through a specific solution based on your data and model.

I hope this is helpful.

  • Brian

Hi Brian,

Thanks for your prompt reply.

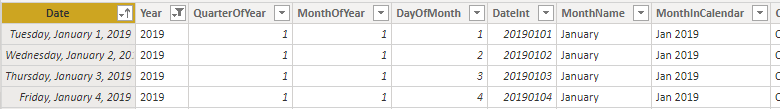
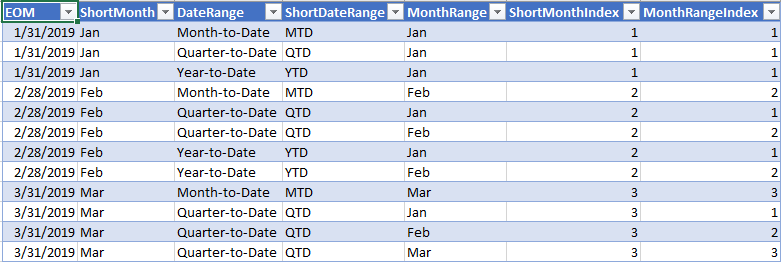
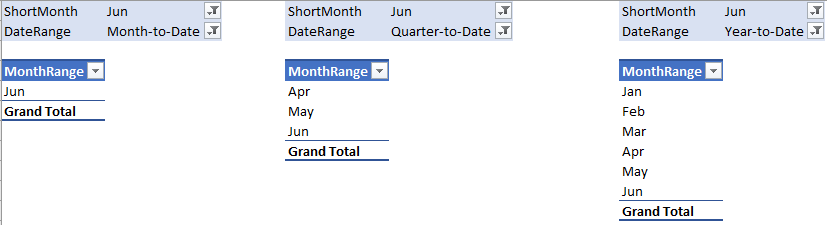
I saw these videos previously but none of the videos I searched for was giving the example with date range as “attribute”… but but rethinking about it… what I did is build manually the date range table as follows… using “ShortMonth” as page/report filter, “DateRange” as slicer, “MonthRange” as axis column in chart and it works :slight_smile:

Thanks for the support :wink:

ShortMonth DateRange ShortDateRange MonthRange ShortMonthIndex MonthRangeIndex
Jan Month-to-Date MTD Jan 1 1
Jan Quarter-to-Date QTD Jan 1 1
Jan Year-to-Date YTD Jan 1 1
Feb Month-to-Date MTD Feb 2 2
Feb Quarter-to-Date QTD Jan 2 1
Feb Quarter-to-Date QTD Feb 2 2
Feb Year-to-Date YTD Jan 2 1
Feb Year-to-Date YTD Feb 2 2
Mar Month-to-Date MTD Mar 3 3
Mar Quarter-to-Date QTD Jan 3 1
Mar Quarter-to-Date QTD Feb 3 2
Mar Quarter-to-Date QTD Mar 3 3
Mar Year-to-Date YTD Jan 3 1
Mar Year-to-Date YTD Feb 3 2
Mar Year-to-Date YTD Mar 3 3
Apr Month-to-Date MTD Apr 4 4
Apr Quarter-to-Date QTD Apr 4 4
Apr Year-to-Date YTD Jan 4 1
Apr Year-to-Date YTD Feb 4 2
Apr Year-to-Date YTD Mar 4 3
Apr Year-to-Date YTD Apr 4 4
May Month-to-Date MTD May 5 5
May Quarter-to-Date QTD Apr 5 4
May Quarter-to-Date QTD May 5 5
May Year-to-Date YTD Jan 5 1
May Year-to-Date YTD Feb 5 2
May Year-to-Date YTD Mar 5 3
May Year-to-Date YTD Apr 5 4
May Year-to-Date YTD May 5 5
Jun Month-to-Date MTD Jan 6 1
Jun Quarter-to-Date QTD Apr 6 4
Jun Quarter-to-Date QTD May 6 5
Jun Quarter-to-Date QTD Jun 6 6
Jun Year-to-Date YTD Jan 6 1
Jun Year-to-Date YTD Feb 6 2
Jun Year-to-Date YTD Mar 6 3
Jun Year-to-Date YTD Apr 6 4
Jun Year-to-Date YTD May 6 5
Jun Year-to-Date YTD Jun 6 6
Jul Month-to-Date MTD Jul 7 7
Jul Quarter-to-Date QTD Jul 7 7
Jul Year-to-Date YTD Jan 7 1
Jul Year-to-Date YTD Feb 7 2
Jul Year-to-Date YTD Mar 7 3
Jul Year-to-Date YTD Apr 7 4
Jul Year-to-Date YTD May 7 5
Jul Year-to-Date YTD Jun 7 6
Jul Year-to-Date YTD Jul 7 7
Aug Month-to-Date MTD Aug 8 8
Aug Quarter-to-Date QTD Jul 8 7
Aug Quarter-to-Date QTD Aug 8 8
Aug Year-to-Date YTD Jan 8 1
Aug Year-to-Date YTD Feb 8 2
Aug Year-to-Date YTD Mar 8 3
Aug Year-to-Date YTD Apr 8 4
Aug Year-to-Date YTD May 8 5
Aug Year-to-Date YTD Jun 8 6
Aug Year-to-Date YTD Jul 8 7
Aug Year-to-Date YTD Aug 8 8
Sep Month-to-Date MTD Sep 9 9
Sep Quarter-to-Date QTD Jul 9 7
Sep Quarter-to-Date QTD Aug 9 8
Sep Quarter-to-Date QTD Sep 9 9
Sep Year-to-Date YTD Jan 9 1
Sep Year-to-Date YTD Feb 9 2
Sep Year-to-Date YTD Mar 9 3
Sep Year-to-Date YTD Apr 9 4
Sep Year-to-Date YTD May 9 5
Sep Year-to-Date YTD Jun 9 6
Sep Year-to-Date YTD Jul 9 7
Sep Year-to-Date YTD Aug 9 8
Sep Year-to-Date YTD Sep 9 9
Oct Month-to-Date MTD Oct 10 10
Oct Quarter-to-Date QTD Oct 10 10
Oct Year-to-Date YTD Jan 10 1
Oct Year-to-Date YTD Feb 10 2
Oct Year-to-Date YTD Mar 10 3
Oct Year-to-Date YTD Apr 10 4
Oct Year-to-Date YTD May 10 5
Oct Year-to-Date YTD Jun 10 6
Oct Year-to-Date YTD Jul 10 7
Oct Year-to-Date YTD Aug 10 8
Oct Year-to-Date YTD Sep 10 9
Oct Year-to-Date YTD Oct 10 10
Nov Month-to-Date MTD Nov 11 11
Nov Quarter-to-Date QTD Oct 11 10
Nov Quarter-to-Date QTD Nov 11 11
Nov Year-to-Date YTD Jan 11 1
Nov Year-to-Date YTD Feb 11 2
Nov Year-to-Date YTD Mar 11 3
Nov Year-to-Date YTD Apr 11 4
Nov Year-to-Date YTD May 11 5
Nov Year-to-Date YTD Jun 11 6
Nov Year-to-Date YTD Jul 11 7
Nov Year-to-Date YTD Aug 11 8
Nov Year-to-Date YTD Sep 11 9
Nov Year-to-Date YTD Oct 11 10
Nov Year-to-Date YTD Nov 11 11
Dec Month-to-Date MTD Dec 12 12
Dec Quarter-to-Date QTD Oct 12 10
Dec Quarter-to-Date QTD Nov 12 11
Dec Quarter-to-Date QTD Dec 12 12
Dec Year-to-Date YTD Jan 12 1
Dec Year-to-Date YTD Feb 12 2
Dec Year-to-Date YTD Mar 12 3
Dec Year-to-Date YTD Apr 12 4
Dec Year-to-Date YTD May 12 5
Dec Year-to-Date YTD Jun 12 6
Dec Year-to-Date YTD Jul 12 7
Dec Year-to-Date YTD Aug 12 8
Dec Year-to-Date YTD Sep 12 9
Dec Year-to-Date YTD Oct 12 10
Dec Year-to-Date YTD Nov 12 11
Dec Year-to-Date YTD Dec 12 12
2 Likes

@Alex7891,

:+1: Clever solution. Thanks for following up and sharing that.

  • Brian

… Actually did not solve everything because I end up with different granularities with existing tables :confused:

Date table with active one-to-many relationship with the below fact table between “Date” column from date table and “EOM” column from fact table:

Fact table:

Date Range table:

What I want is to be able to filter the Date Range table by the ShortMonth and DateRange columns in order to show MonthRange column in a x-axis chart and lookup from fact table the MonthRange value

Any idea how could it be done please ?

@Alex7891,

Whenever I run into granularity mismatch problems, my first thought is always using a combination of SUMMARIZE and TREATAS to resolve. Here are two videos that I think will be helpful:

If you need more specific support, please post your PBIX file as this scenario has gotten complex enough to make it difficult to work out specifically just through screenshots.

Thanks. Hope this is helpful.

  • Brian
1 Like