Hi @lancemillercpa98.
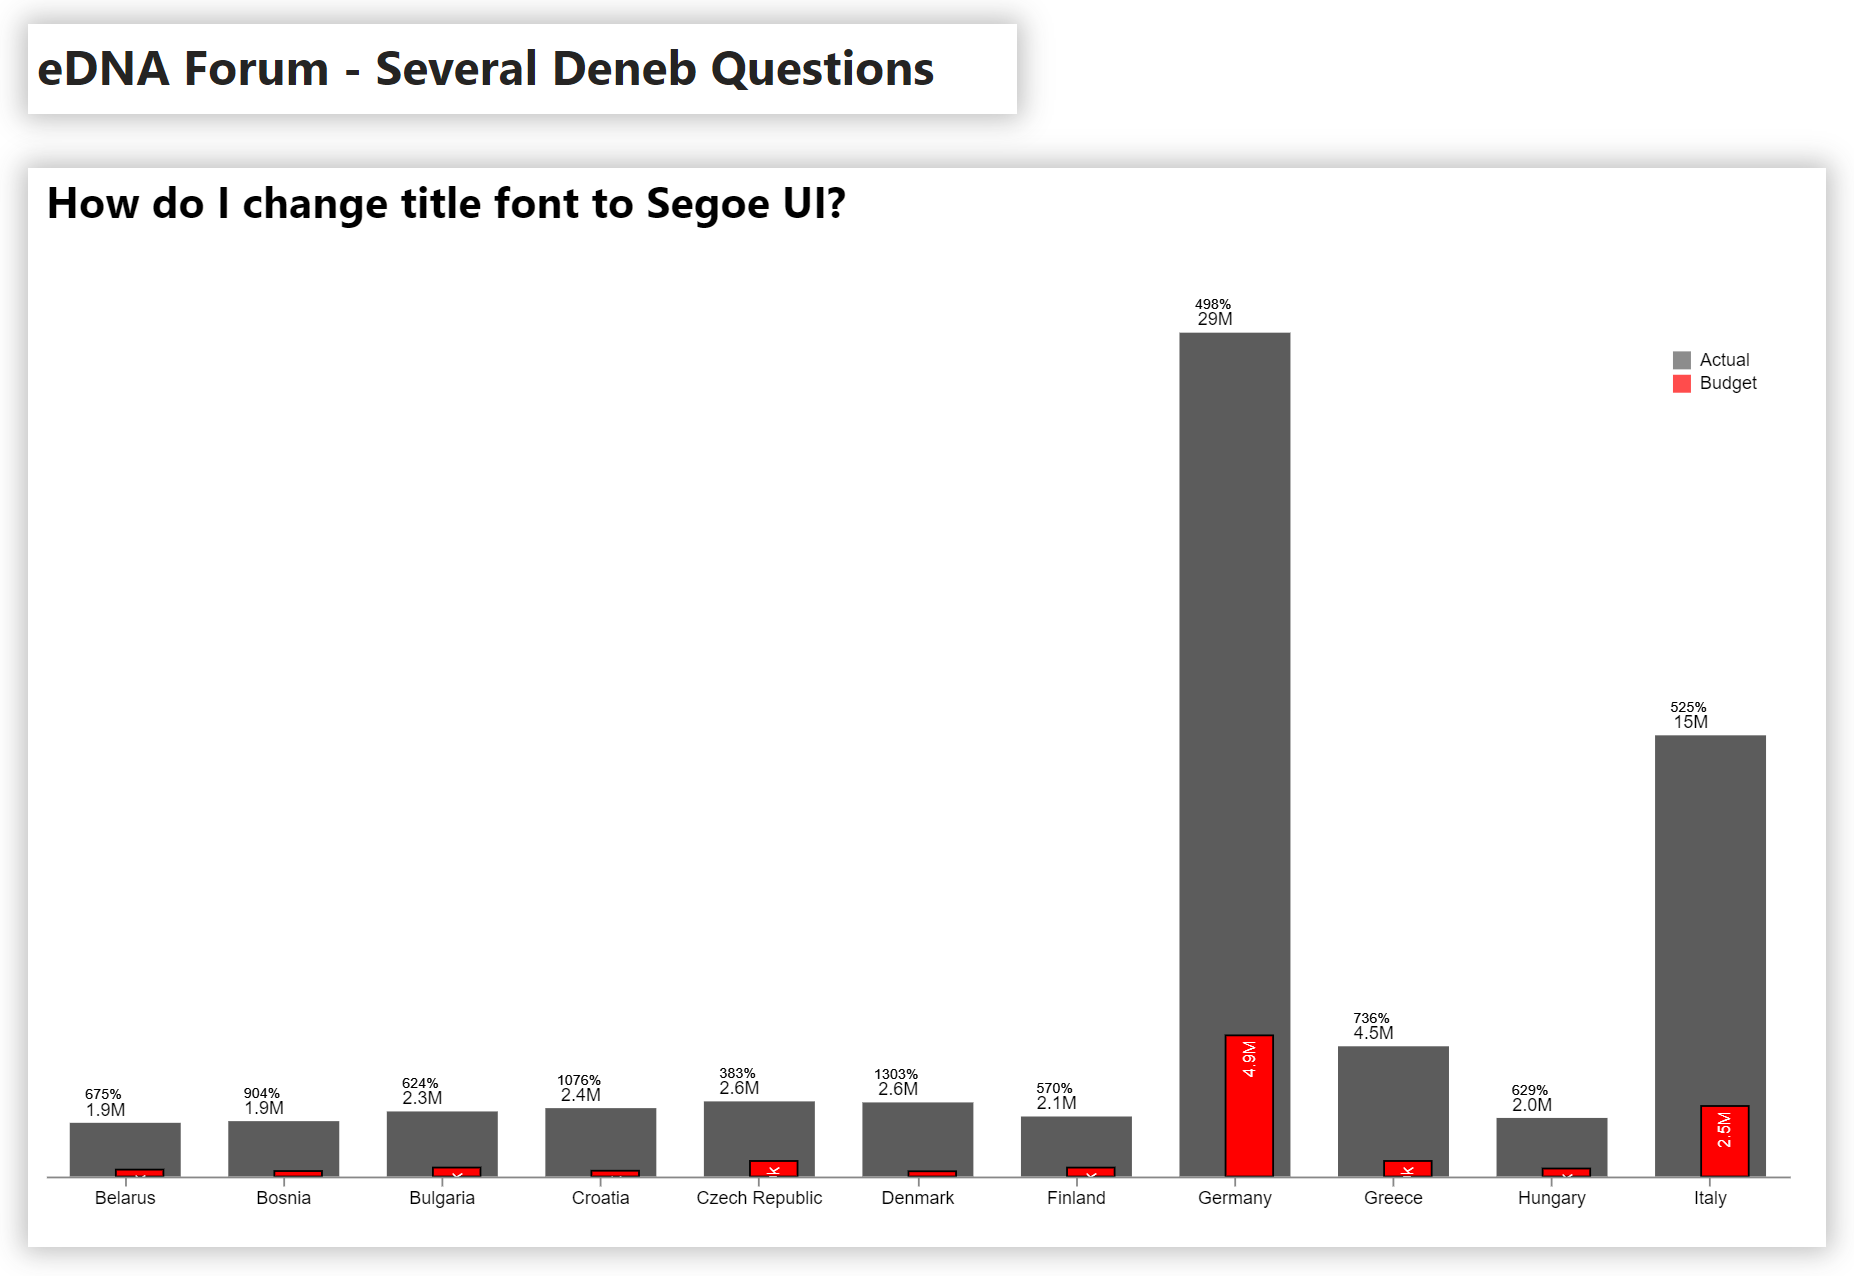
Q1: How to change title font to Segoe UI?
A1: Make the title line an object, set the “text” property, then add a line to the title block: “font”: “Segoe UI”
Q2: How to change padding of title area (may want to slightly increase)?
A2: Add a line to the title block: “offset”: 40,
(adjust number as desired)
Q3: How to eliminate light rectangular boundary around top, left and right sides of graph area?
A3: Add a line to the config section: “view”: {“stroke”: “transparent”}
Q4: How to push down chart (eliminating white space on bottom, below countries)?
A4: Add width and height key:value pairs to the visual
(adjust numbers as desired)
Here’s the specification code:
{
  "title": {
    "anchor": "start",
    "align": "left",
    "offset": 40,
    "text": "How do I change title font to Segoe UI?",
    "font": "Segoe UI",
    "fontSize": 24,
    "fontWeight": "bold",
    "fontStyle": "normal"
  },
  "data": {"name": "dataset"},
  "width": 980,
  "height": 580,
  "layer": [
    {
      "transform": [
        {
          "fold": ["Actual", "Budget"],
          "as": ["Metrics", "Number"]
        },
        {
          "calculate": " (datum['Actual'] - datum['Budget'] )/datum['Budget']",
          "as": "Ratio"
        }
      ],
      "layer": [
        {
          "mark": {
            "type": "square",
            "size": 0
          },
          "encoding": {
            "color": {
              "field": "Metrics",
              "scale": {
                "range": [
                  "#5c5c5c",
                  "red"
                ]
              }
            }
          }
        },
        {
          "description": "BACK BAR PERCENT LABEL (displays the component value as a percentage of the budget value)",
          "mark": {
            "type": "text",
            "color": {
              "expr": "datum ['Ratio'] <0 ? 'red':'black' "
            },
            "baseline": "bottom",
            "angle": 0,
            "yOffset": -11,
            "xOffset": -12,
            "size": 8
          },
          "encoding": {
            "y": {
              "field": "Actual",
              "type": "quantitative"
            },
            "text": {
              "field": "Ratio",
              "format": "#.%",
              "formatType": "pbiFormat"
            }
          }
        }
      ]
    },
    {
      "description": "BACK ACTUAL BAR",
      "mark": {
        "type": "bar",
        "color": "#5c5c5c",
        "tooltip": true,
        "width": {
          "expr": "bandwidth('x') * 0.7"
        }
      }
    },
    {
      "description": "FRONT BUDGET BAR",
      "mark": {
        "type": "bar",
        "width": {
          "expr": "bandwidth('x') * 0.3"
        },
        "color": "red",
        "tooltip": true,
        "stroke": "black",
        "xOffset": 8
      },
      "encoding": {
        "y": {
          "field": "Budget",
          "type": "quantitative",
          "axis": null
        }
      }
    },
    {
      "description": "Displays the Actual value)",
      "mark": {
        "type": "text",
        "color": "black",
        "baseline": "bottom",
        "angle": 0,
        "yOffset": -2,
        "xOffset": -11,
        "size": 10
      },
      "encoding": {
        "text": {
          "field": "Actual",
          "format": ",.2s"
        }
      }
    },
    {
      "description": "Displays the Budget value)",
      "mark": {
        "type": "text",
        "color": "white",
        "xOffset": 8,
        "angle": 270,
        "size": 9,
        "dx": -3,
        "align": "right"
      },
      "encoding": {
        "text": {
          "field": "Budget",
          "format": ",.2s"
        },
        "y": {
          "field": "Budget",
          "type": "quantitative",
          "axis": null
        }
      }
    }
  ],
  "encoding": {
    "x": {
      "field": "Mon",
      "sort": "",
      "axis": {
        "title": null,
        "labelAngle": 0,
        "zindex": 1
      }
    },
    "y": {
      "field": "Actual",
      "type": "quantitative",
      "axis": null
    }
  }
}
Here’s the config code:
{
  "view": {"stroke": "transparent"},
  "autosize": {
    "type": "fit",
    "contains": "padding"
  },
  "legend": {
    "title": null,
    "orient": "top-right",
    "labelfontsize": 20,
    "labfont": "Segoe UI"
  }
}
Hope it helps.
Greg
eDNA Forum - Several Deneb Questions.pbix (1.6 MB)