Hello @Greg ,
I really liked your Deneb Example - Linked Charts - Deneb Showcase - Enterprise DNA Forum
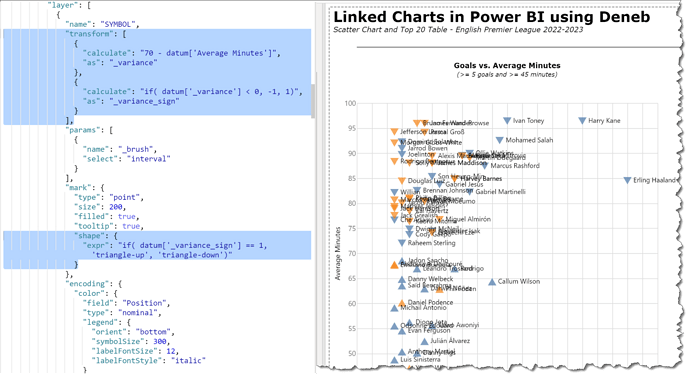
I was actually working on something similar where I have forecasts vs actuals plotted on the x/y axis with the possibility to select points giving details about each project on the right table.
Your example gave me the idea to plot the shape of the points based on a field (in my case actuals minus forecast sign) - I had not thought about this - and it looks great.
However, I would like to be able to specify which shape to use (in my case, triangle down for negatives, triangle up for positives). In the vega-lite documentation, it says that “shape” accepts an expression, but I was not able to make it work.
Taking your very nice example, how would you modify the “shape” code
“shape”: {
“field”: “Position”,
“type”: “nominal”,
}
in the “SYMBOL” layer to get the shape you want instead of the ones that are automatically attributed by Vega-Lite? (round and square)
(I am not attaching any files as your example is a perfect template for this question)
Thanks!
Kind regards
Valeria
