Builds 22 - Hotels Revenue Management

Hi everyone, this is an entry submitted by Dharmendar S via email.

Here’s how Dharmendar S described it:

Please see my entry for Challenge 22 “Hotel Revenue Management”. I hope you like it"

You can view the full report here
Dharmendar S

Please feel free to give Dharmendar S your feedback on his report.

7 Likes

Hi Everyone,

This is my entry for this challenge.

First thanks to Enteprise Challenge Team for putting time count down (so I realize that I had much more time then I initially thought and @FPastor for putting model for this challenge and save me a lots of time so I manage to finish this submission on time. Also thanks for this interesting data set and challenge.

First I spent some time to analyze the data and to explore discrepancies among the data from data source.

Therefore some of the values are corrected like:
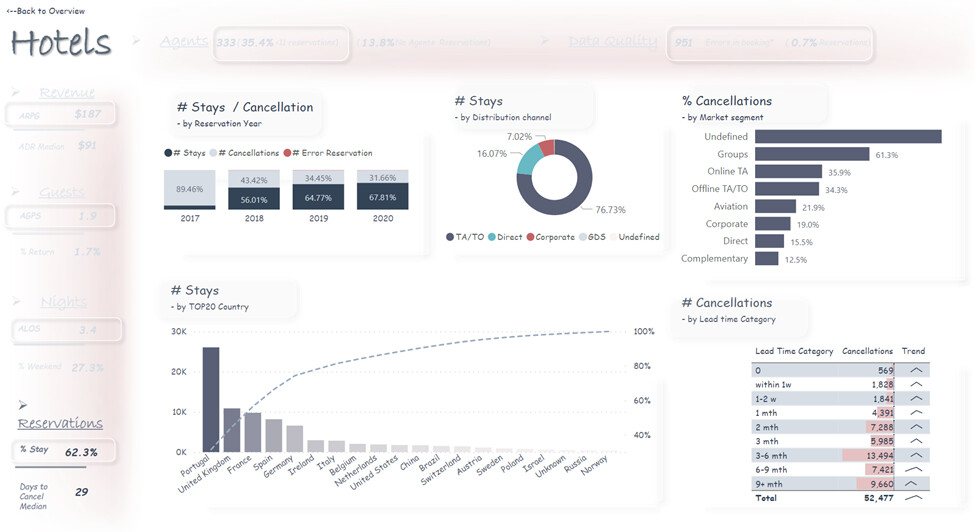
• Reservations – are divided: Reservations (all), Cancellation (which are cancelled in ‘normal procedures’ either via Cancellation / No show) , Error Reservation (which are In status Checked-out but without guests or without nights)
• There for Revenue is also corrected – to simplify the process I add indicator Ind InRevenue 0/1
• Agents countrows -1 (since Agent key =1 / ID=0 is actually represents null or No Agent)
• Lead time – since Reservation Date = Arrival Time – Lead time sometimes after Reservation Status I use min of this too and correct Lead Time

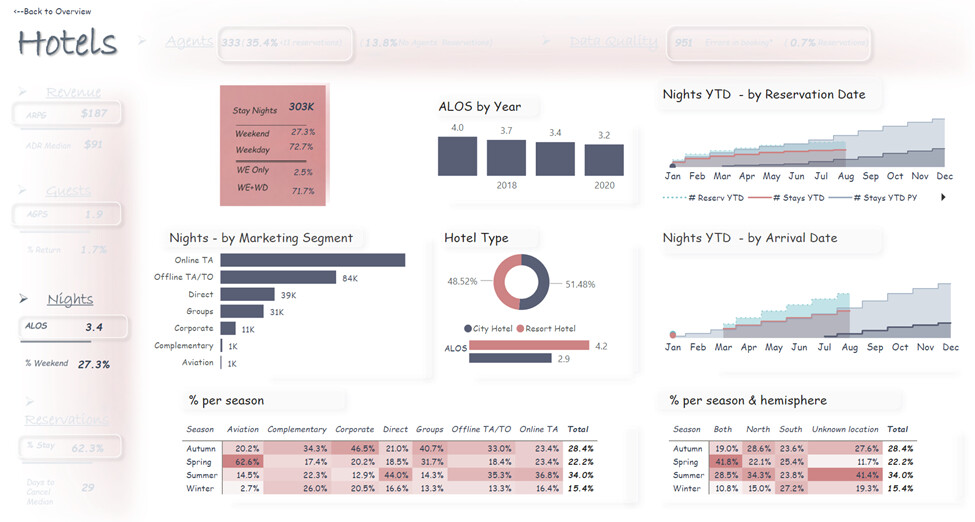
Additional I add hemisphere for countries (from web data sources) to calculate seasons.
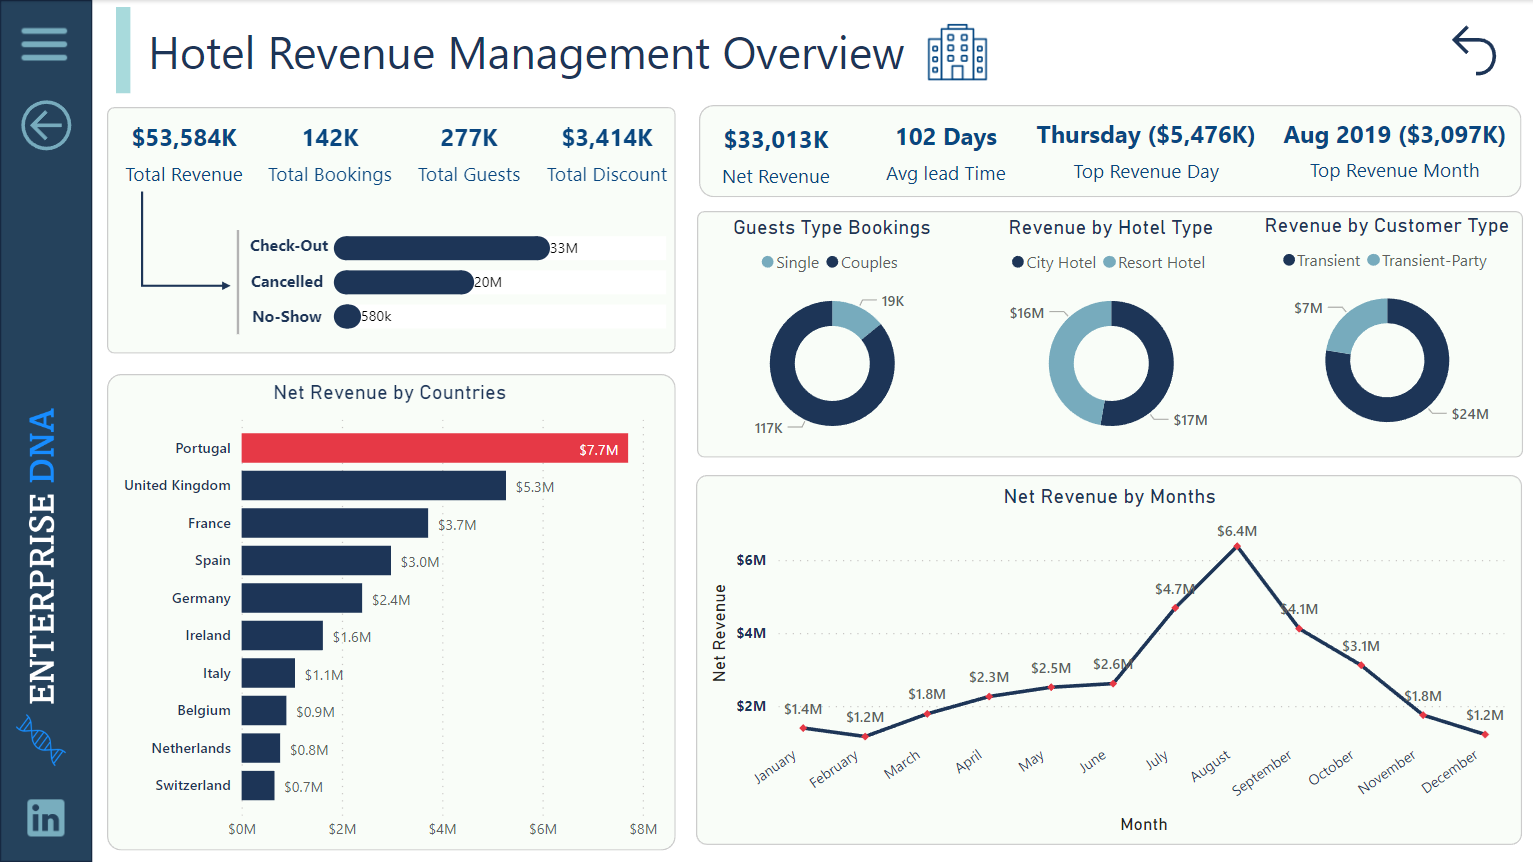
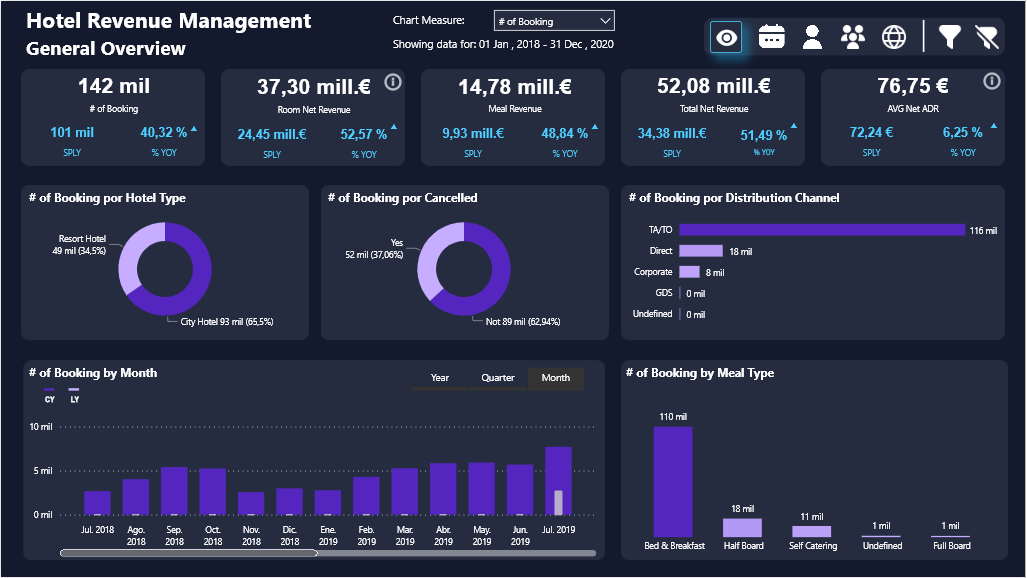
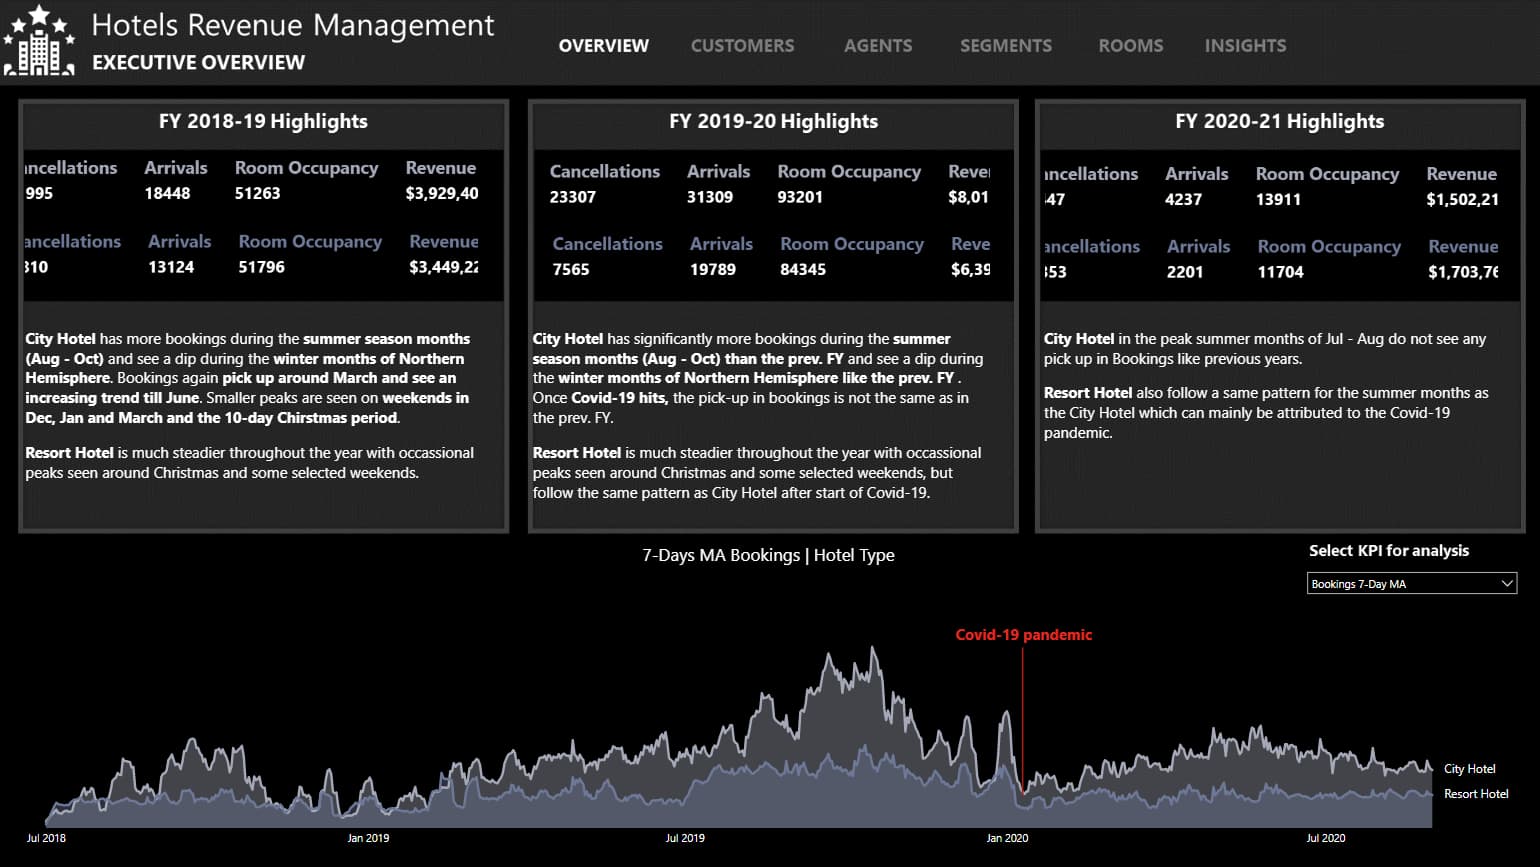
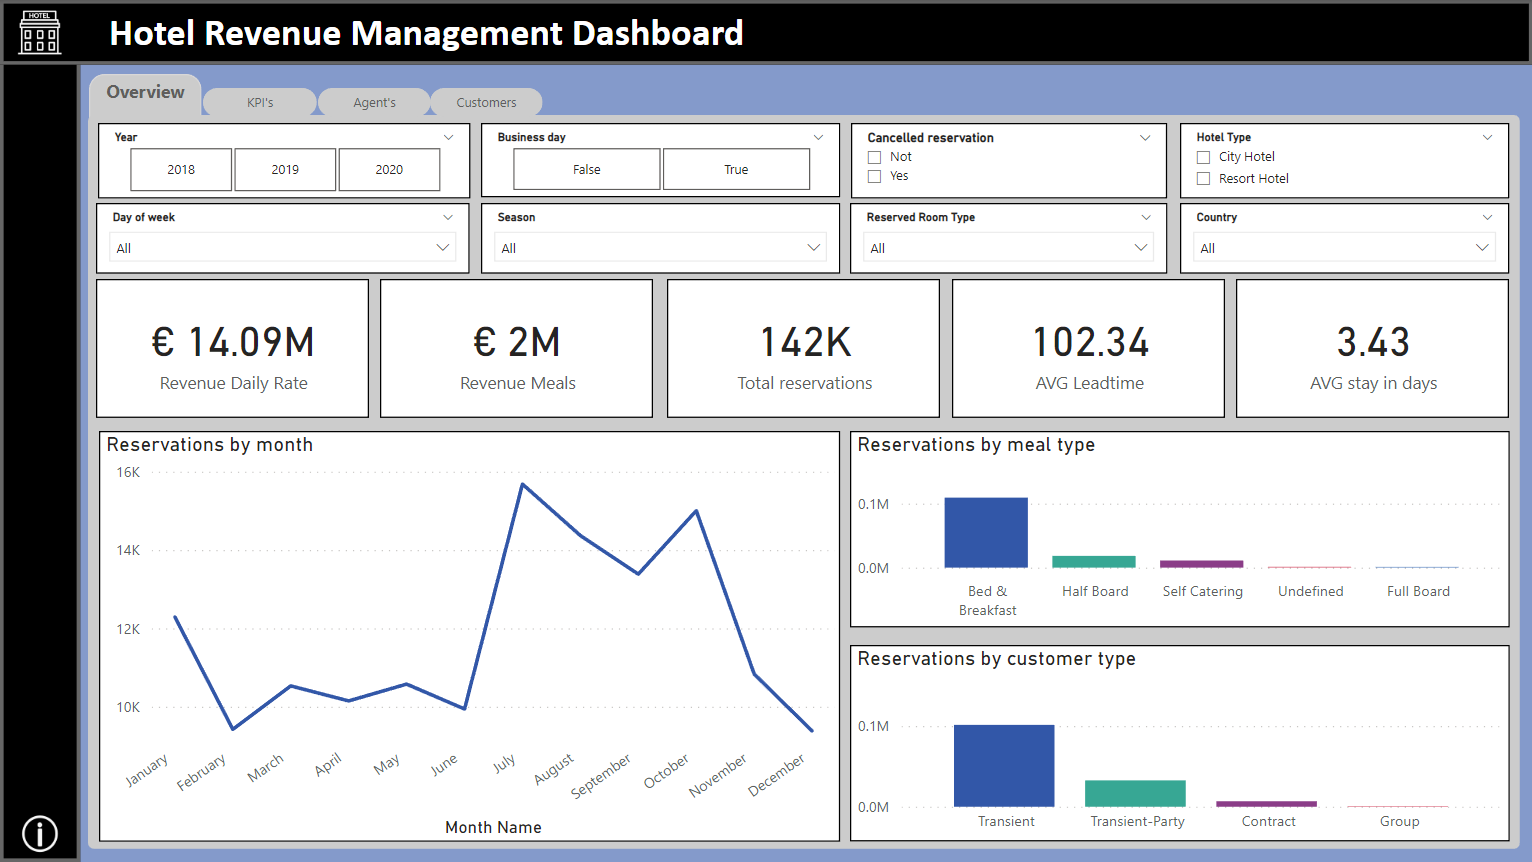
Overview

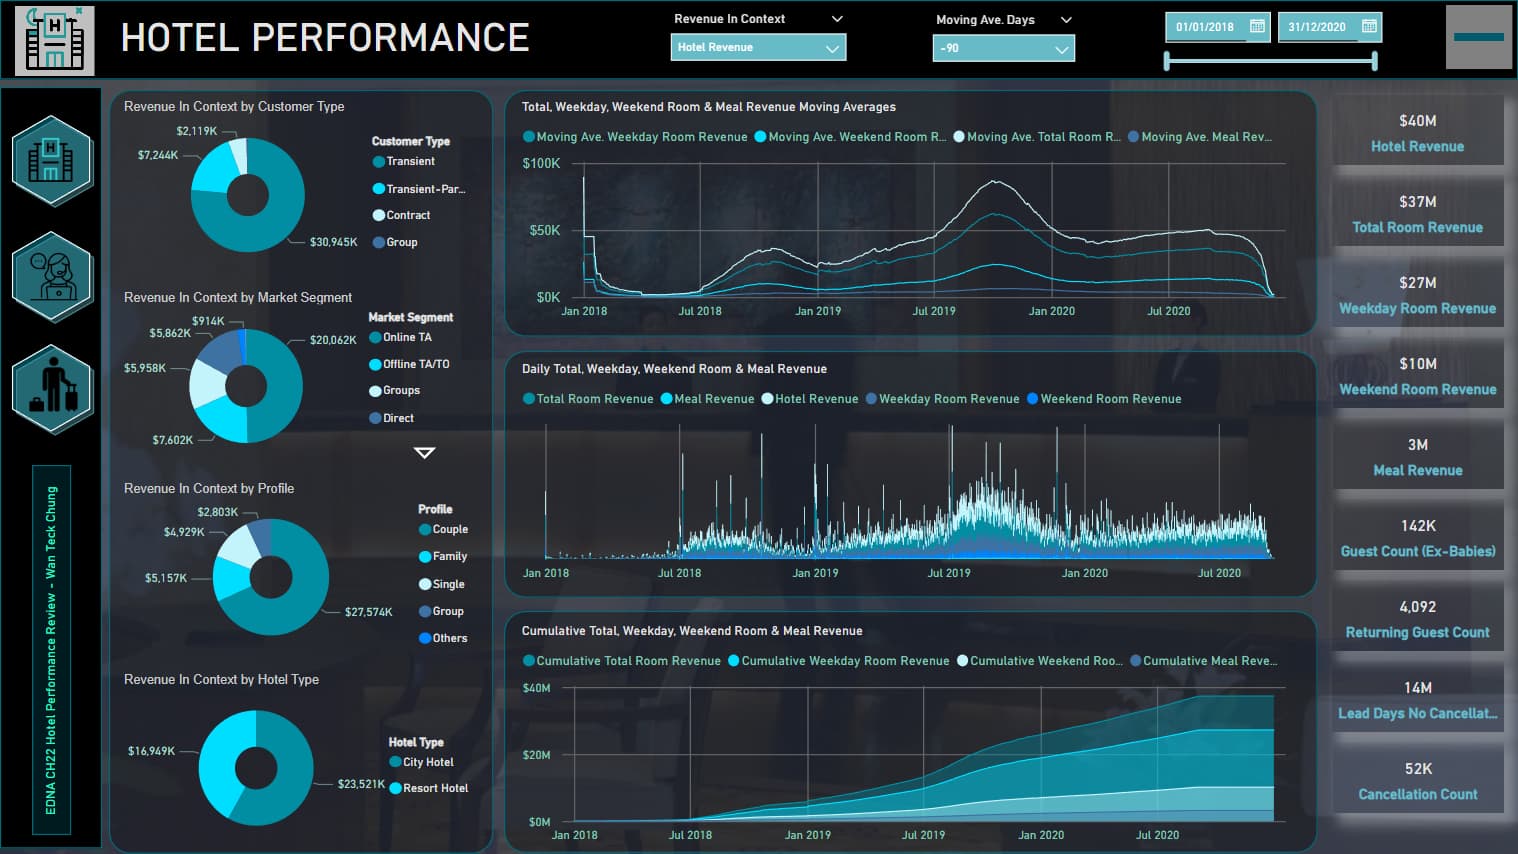
Since „Clients like KPI’s“ & „Client is interested in Agent’s performance, overview“ – I add two types of KPI’s for :
• External ( Revenue, Guests, Nights, Reservations)
• Internal (Agents, Data Quality / Error bookings)

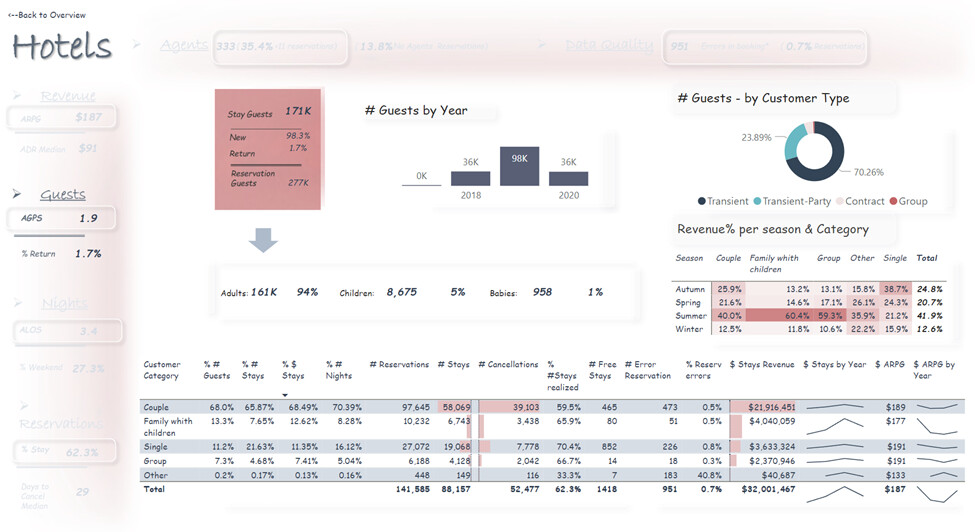
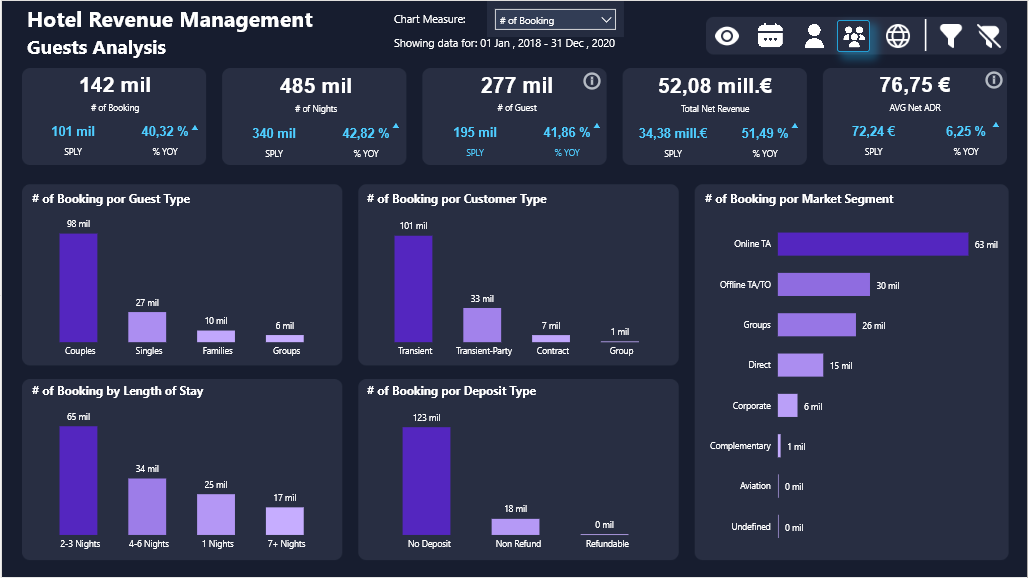
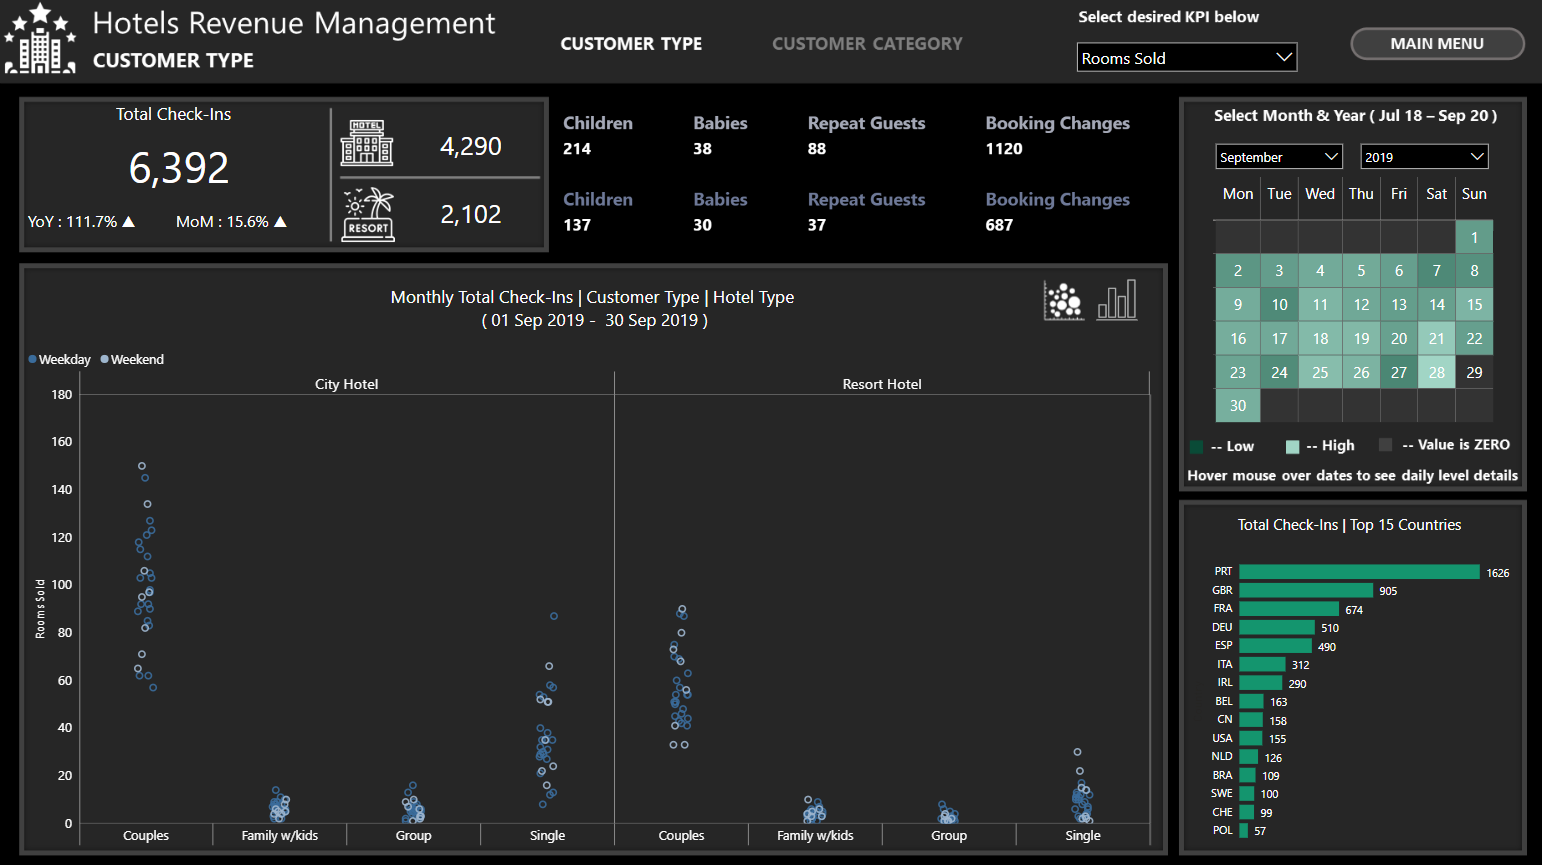
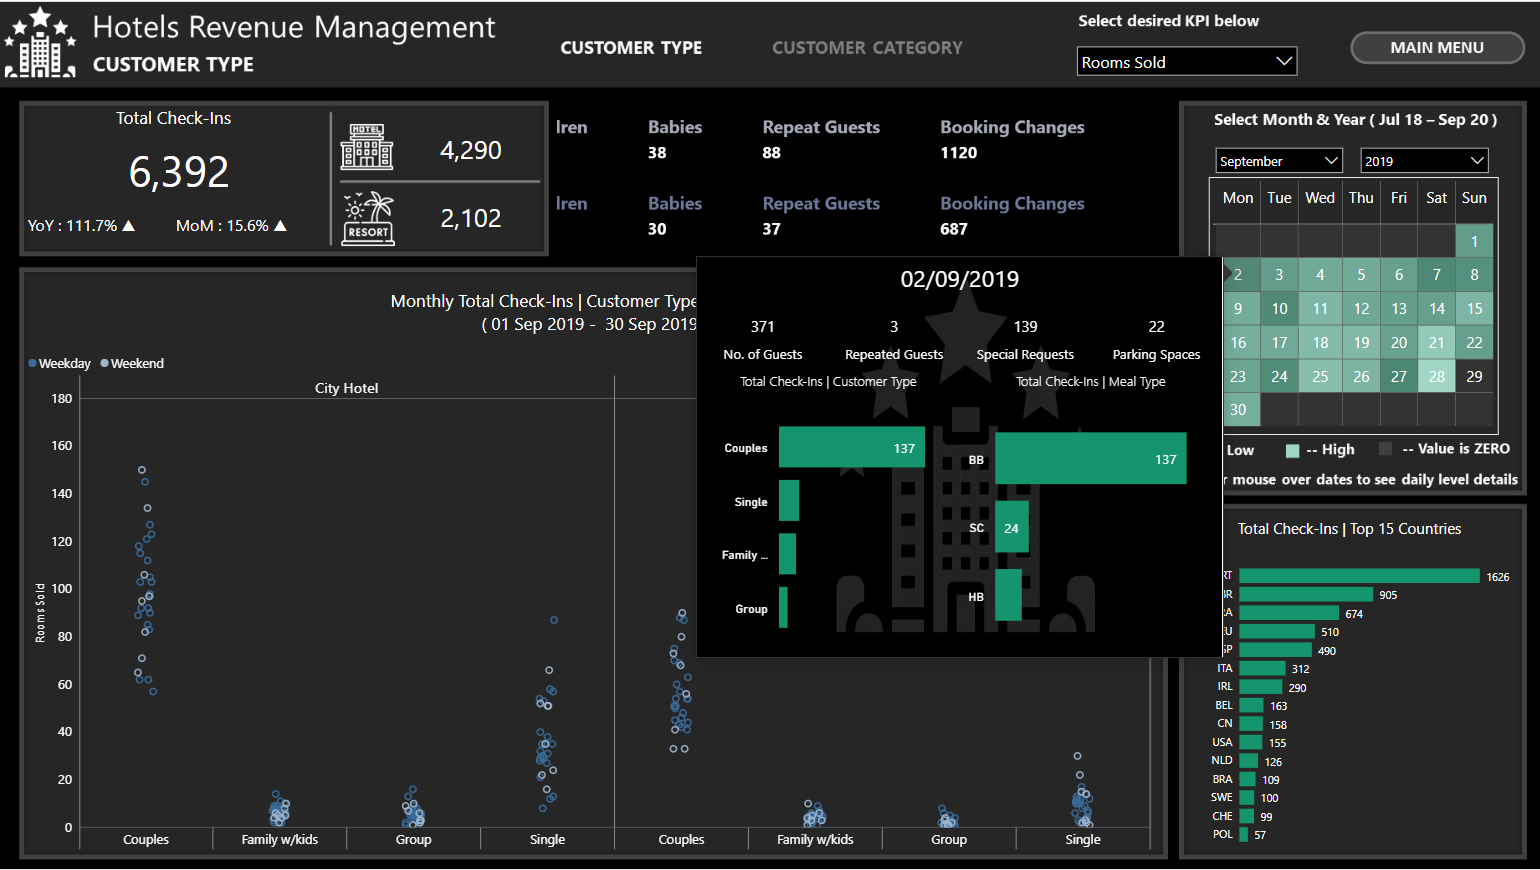
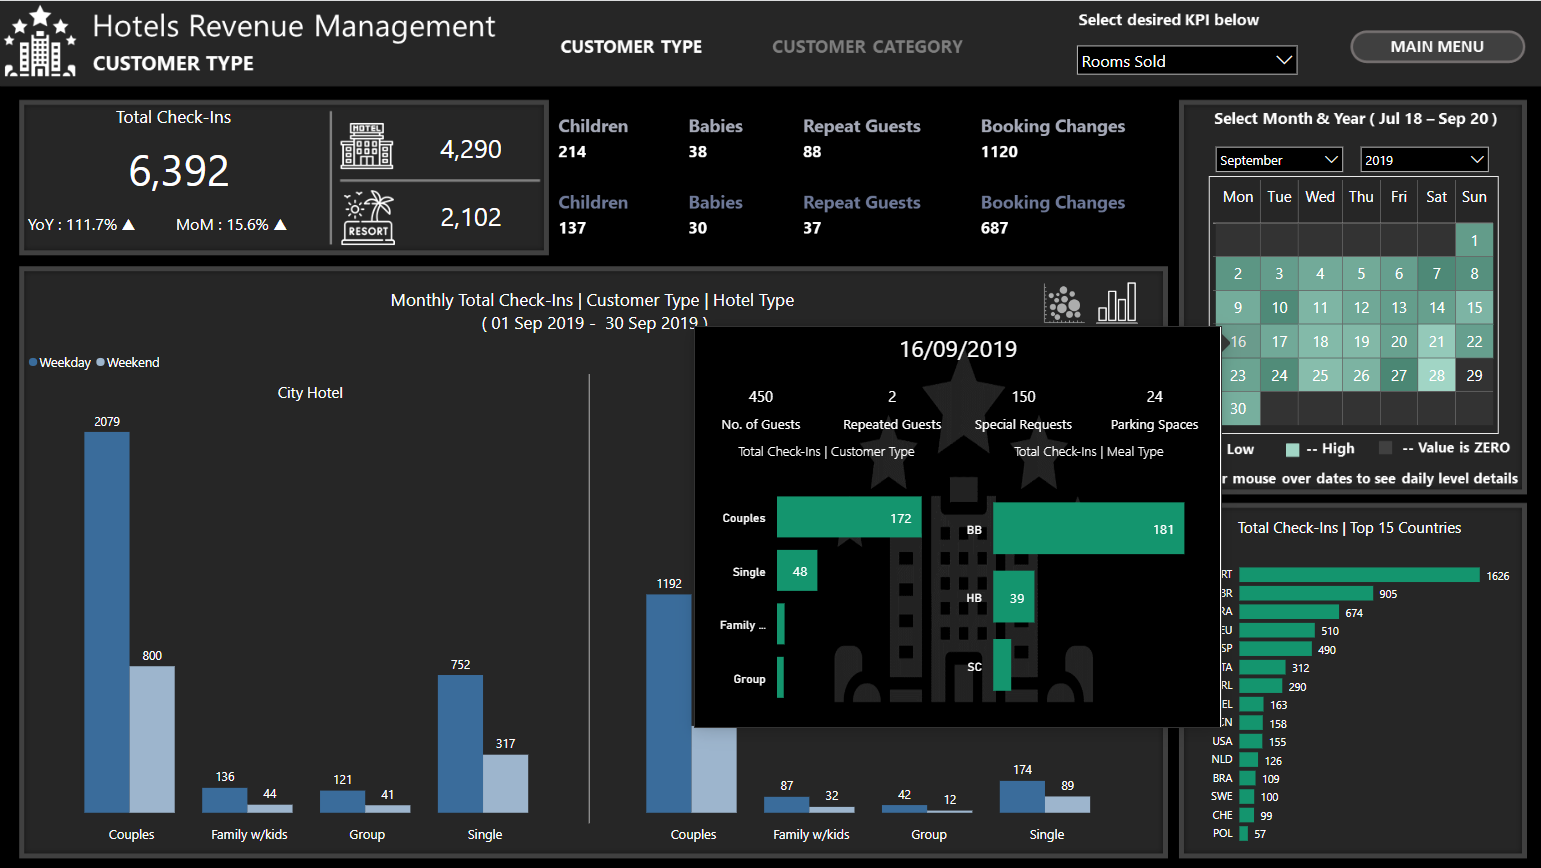
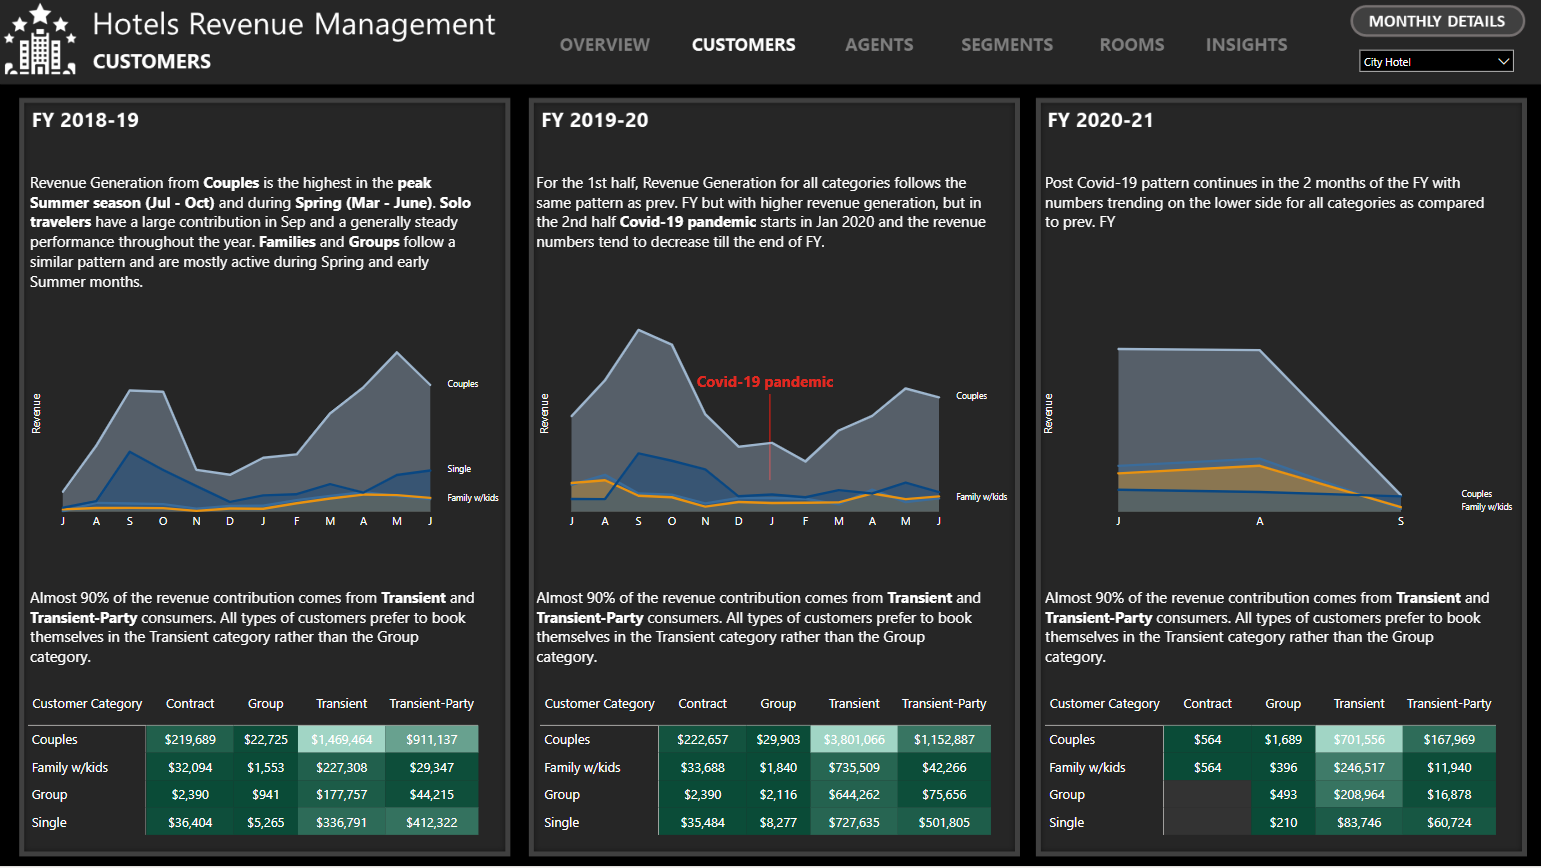
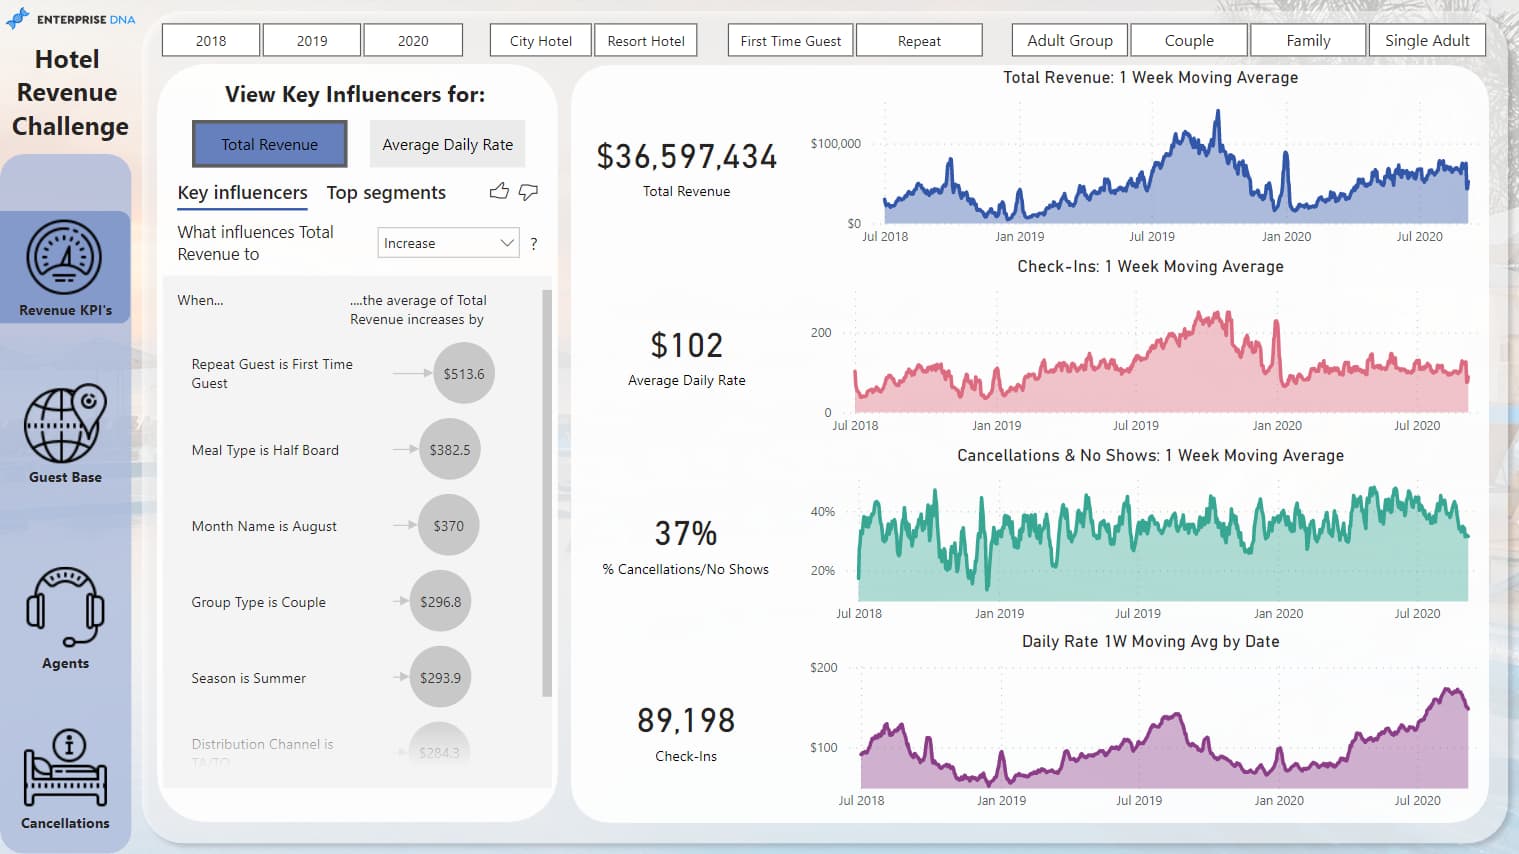
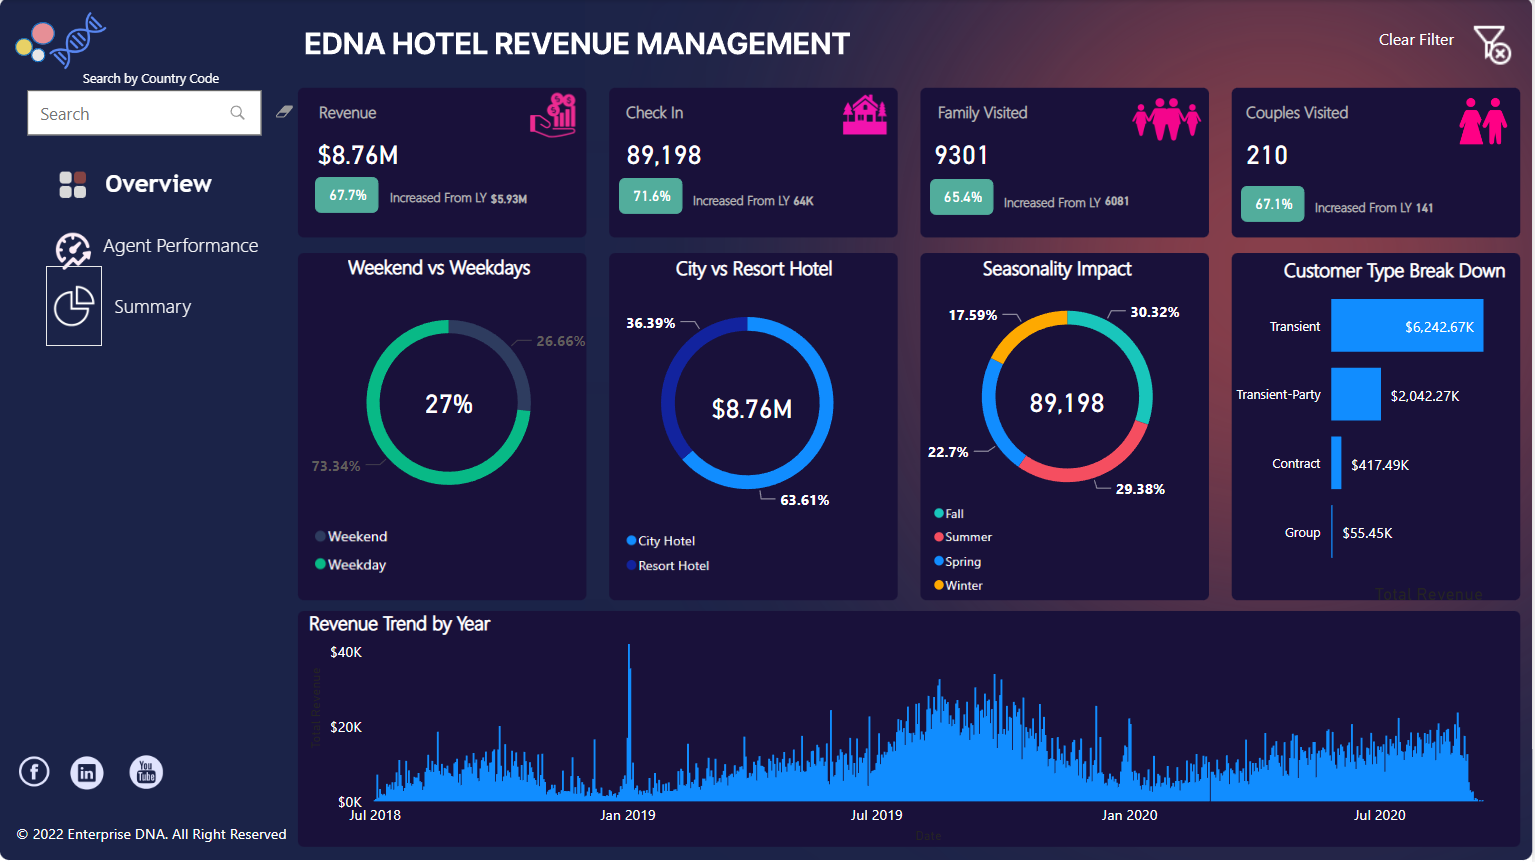
Also since „Client is interested in any other insights providing further information on Customers type (family with children, single or couples visitors) etc.„ – I additional add Clients Category
• Couple (2 Adults)
• Single (1 Adults)
• Group ( 2+Adults)
• Family with children ( Adults+ Children/Babies)
• Other (believe it or not there are also only Children and Babies with no Adults) – I suppose it is in additional rooms / reservations but I separate them details can be see later
For all Revenue, Guests, Nights KPI’s I use only stays figures (using this Ind InRevenue 0/1 indicator).
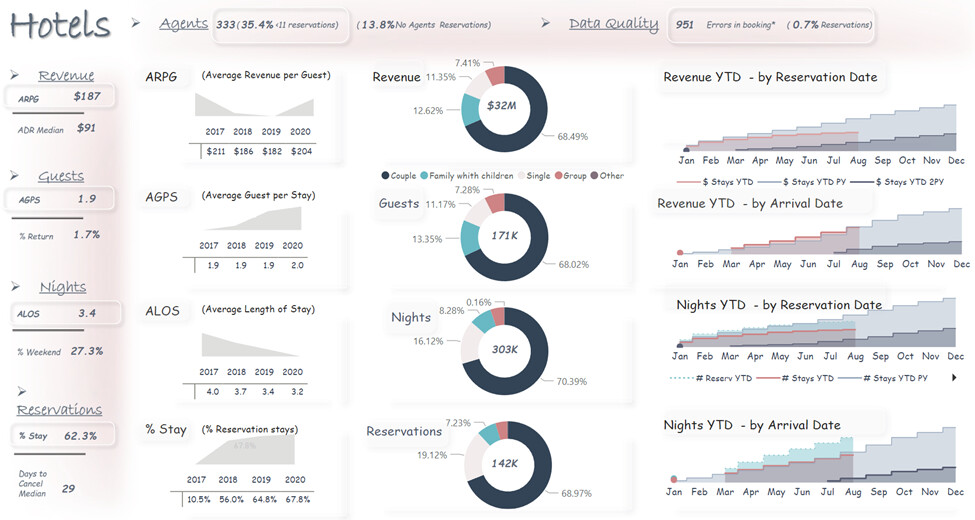
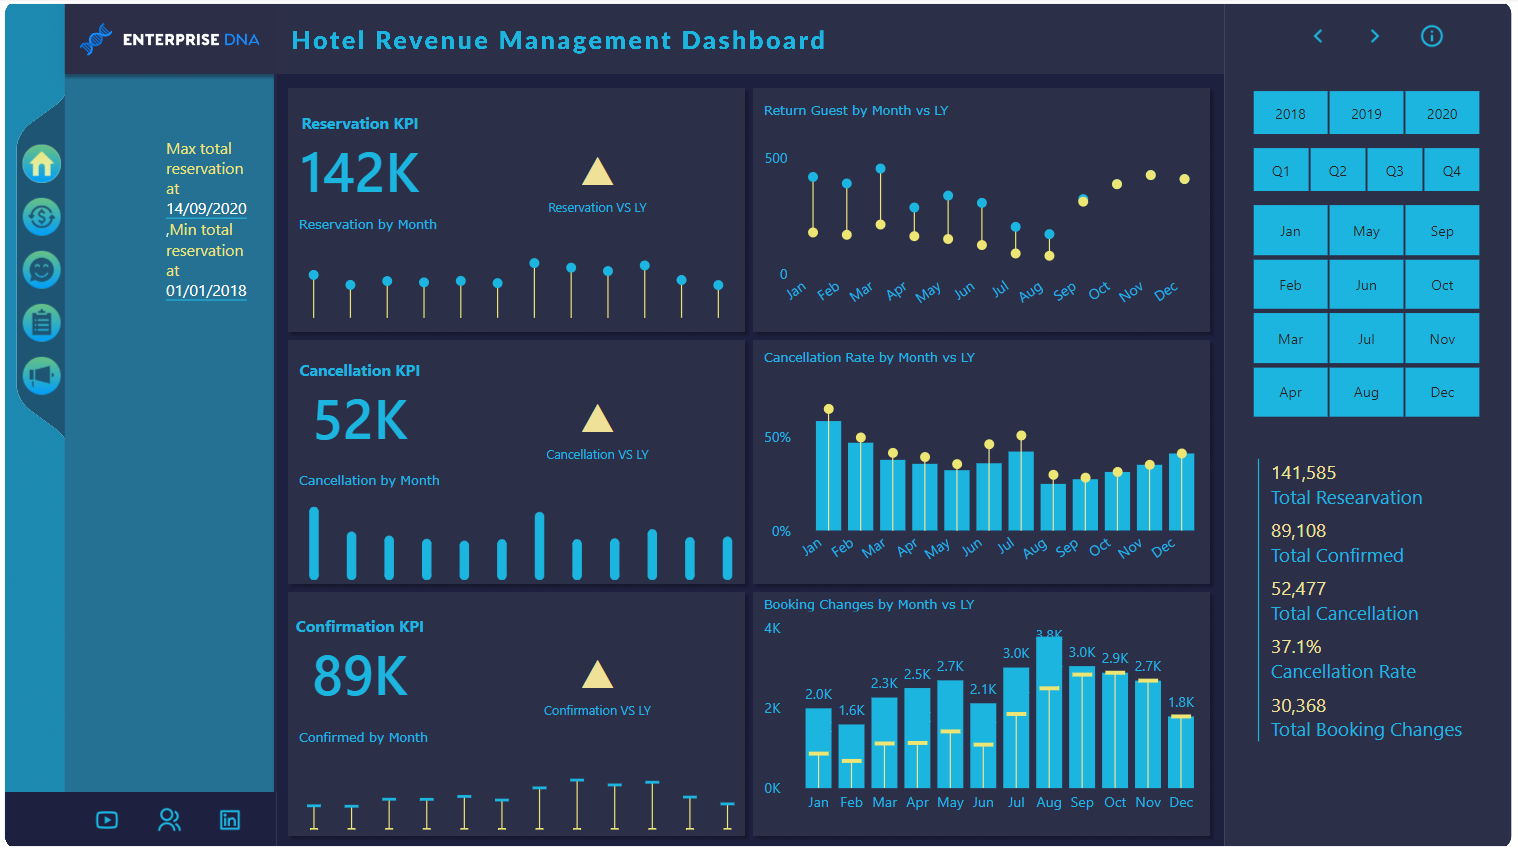
Since max Reservation Statuses are in September, Reservation Date in August 2020:
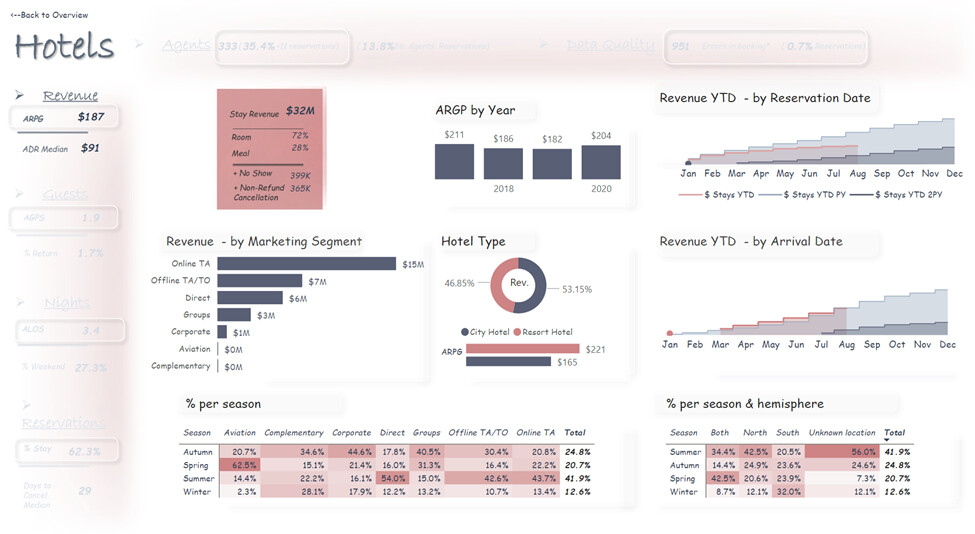
• I use YTD for Time Comparison. Also I add comparison by Arrival Date – and find out that Revenue (for realized reservation/stays) in 2020 is greather then Mar-Jul
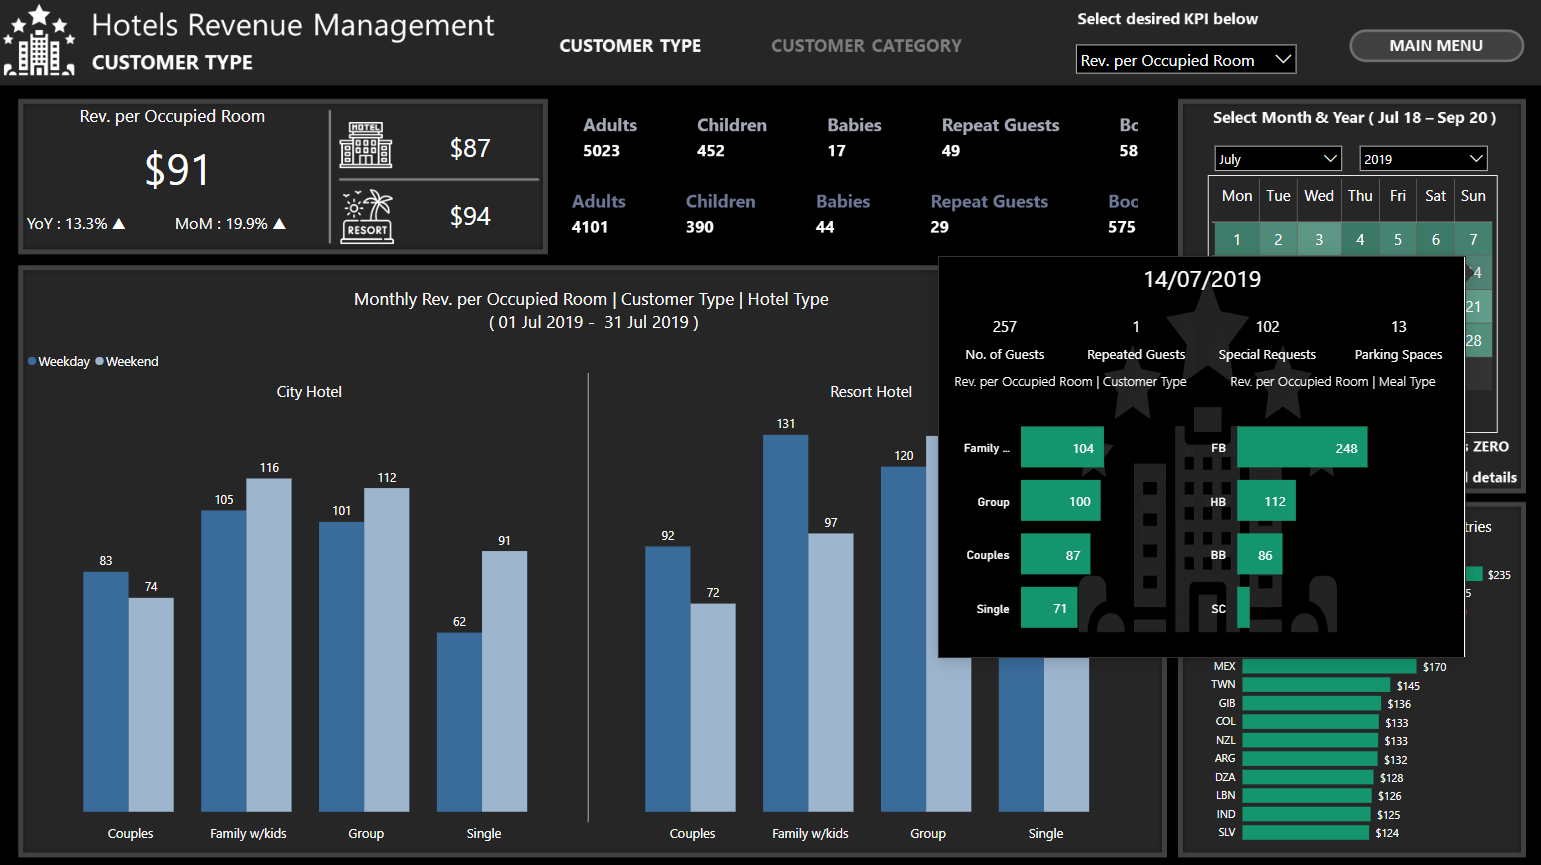
• Use KPI’s that can be calculated no matter partially year data such as :
o Average Revenue per Guest (ARPG)
o Average Guest per Stay (AGPS)
o Average Length of Stay (ALOS)
o % Stay (realization of reservations)
Since I use Reservation Date – also had dates in 2017
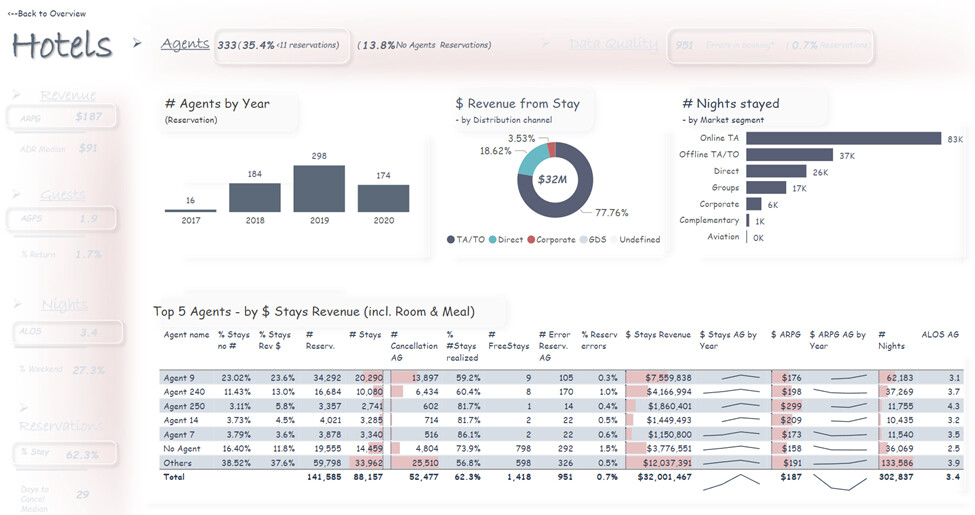
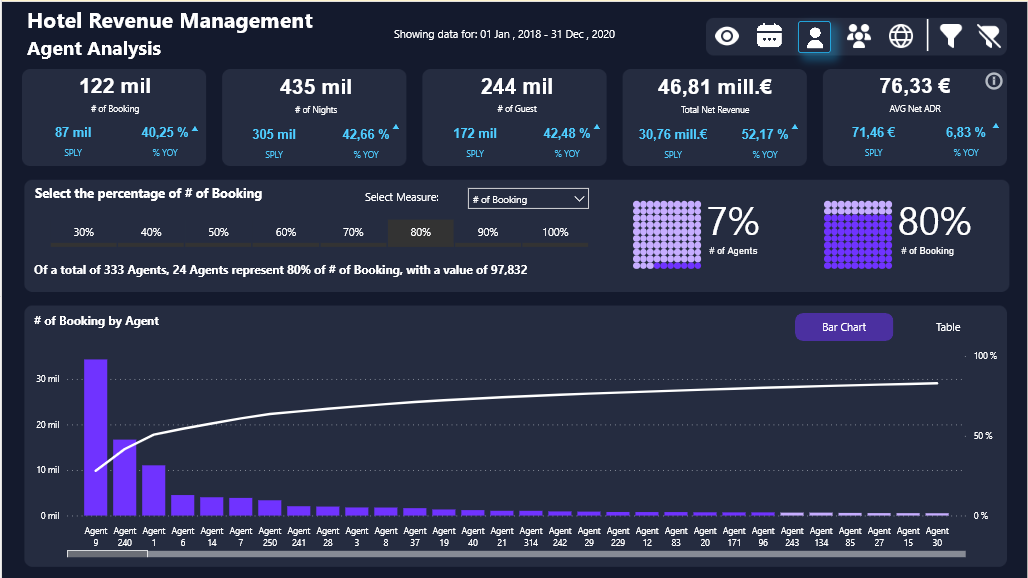
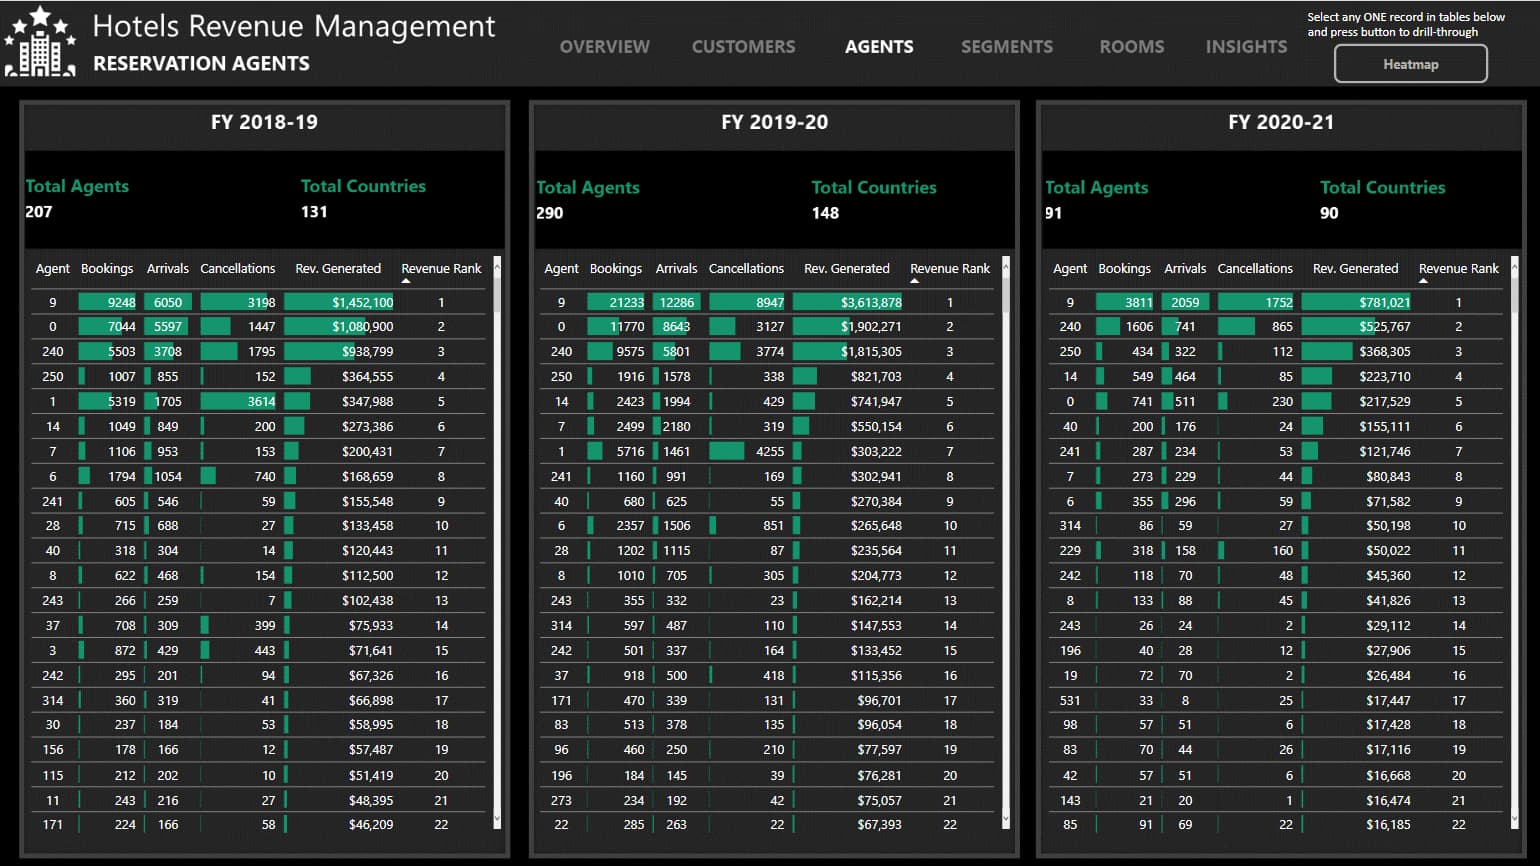
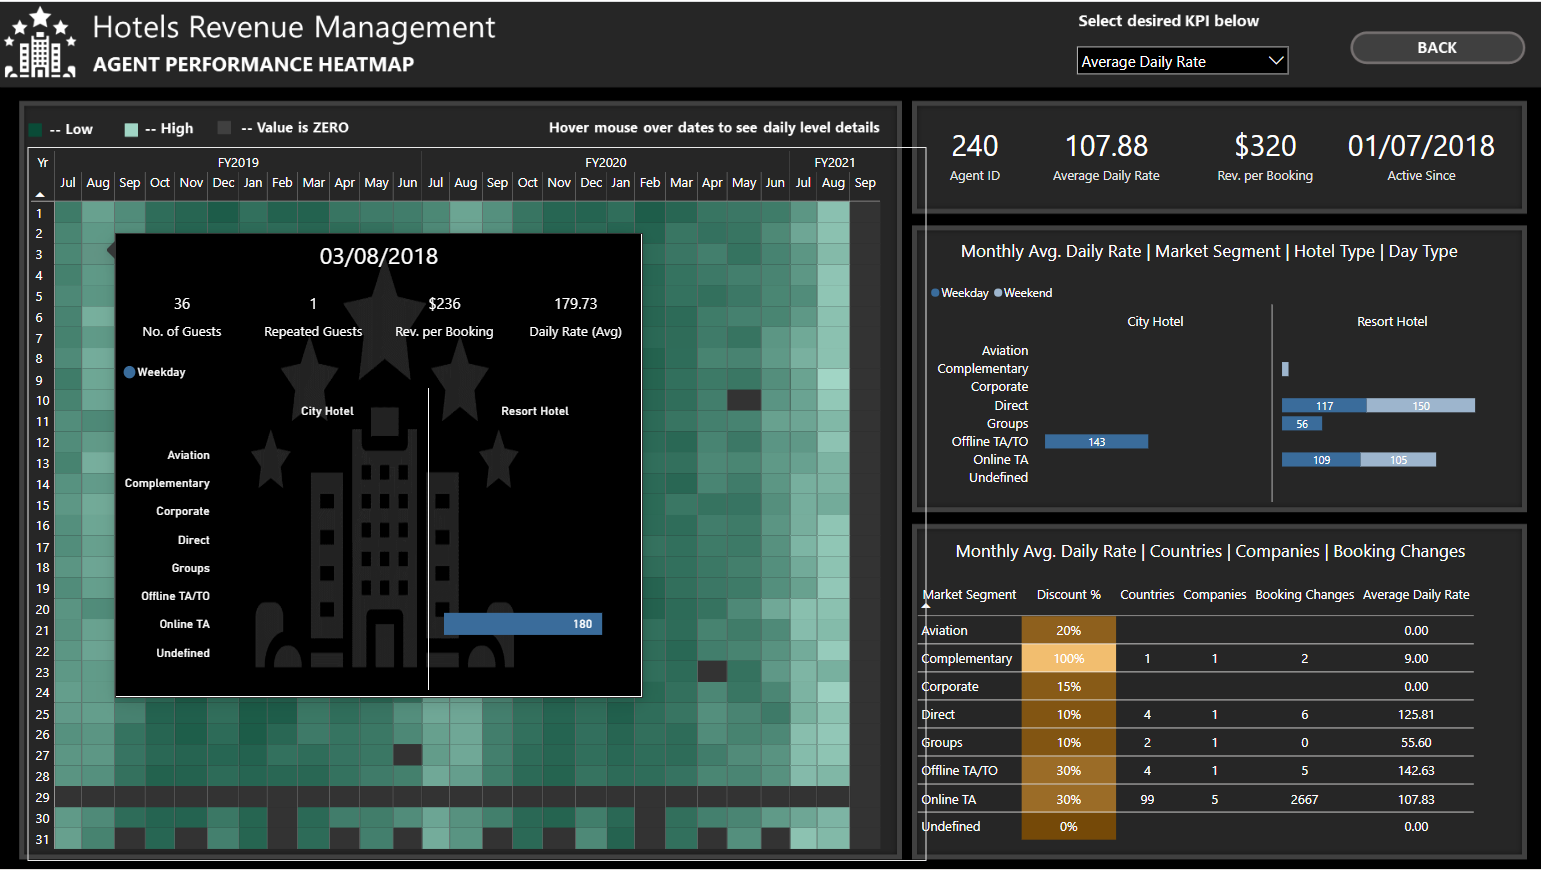
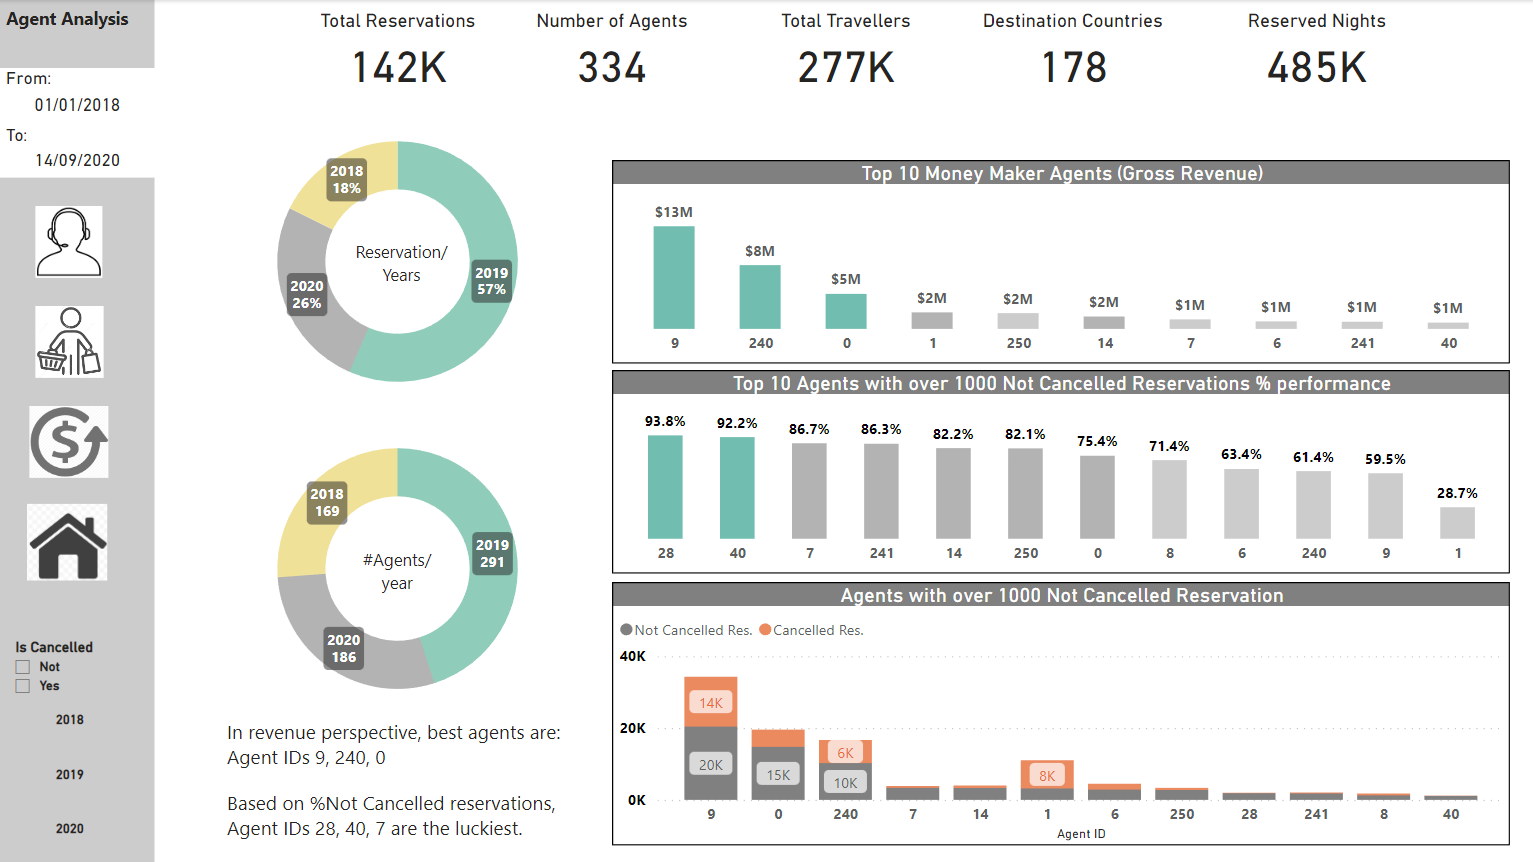
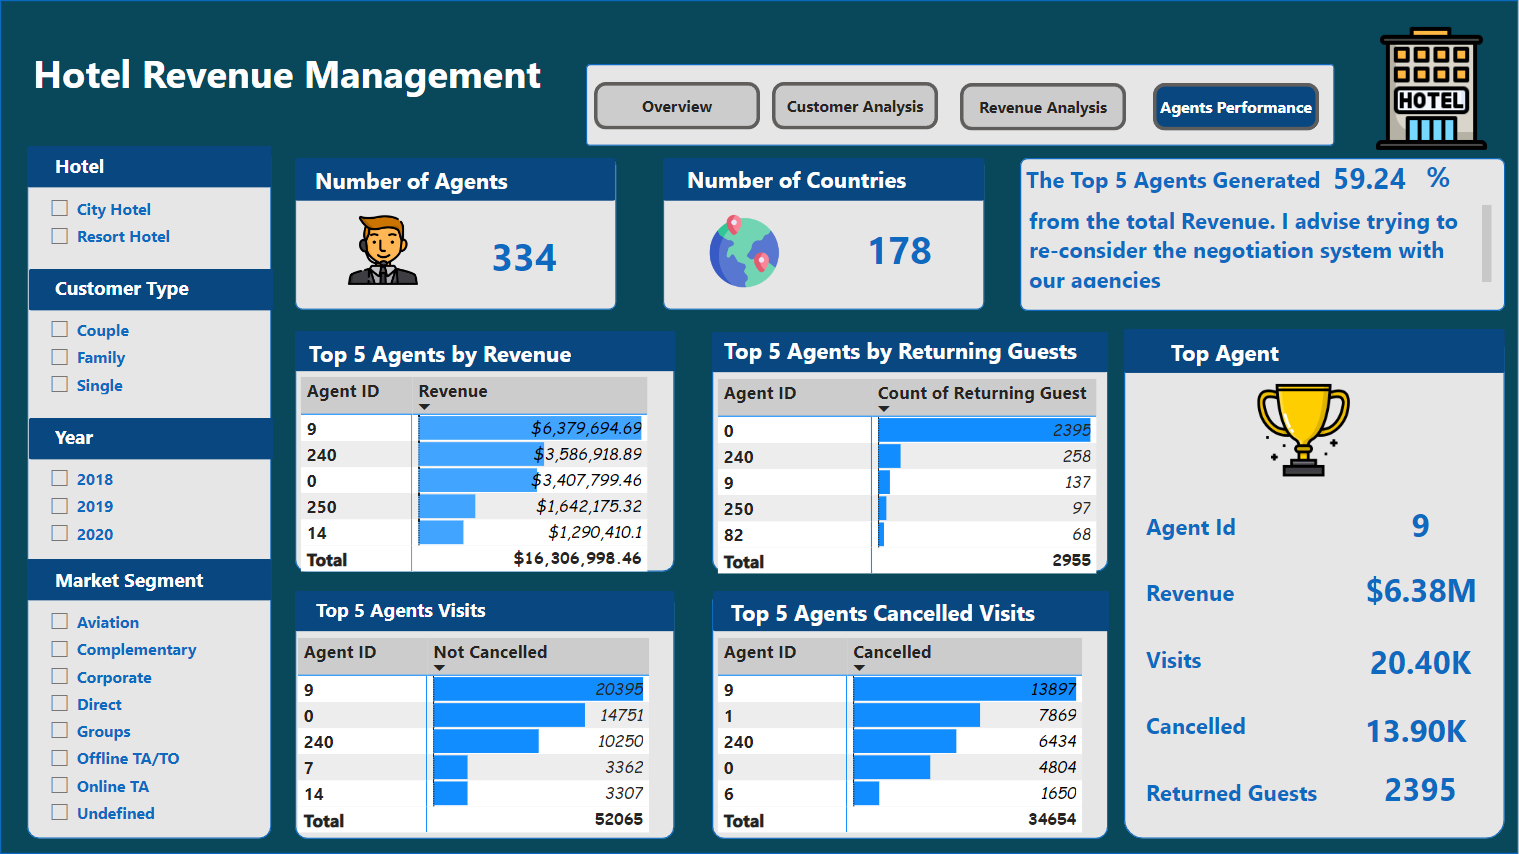
Agents

In table use Top 5 Agents + No Agents + Others

  • Add additional row for Others (+calculations)
  • Little bit re-calculate Ranking (so I can sort by it to have Top 5 + No Agents, Other order)

Also add Free Stay (since some of reservations are in status Check-out with ADR =0)
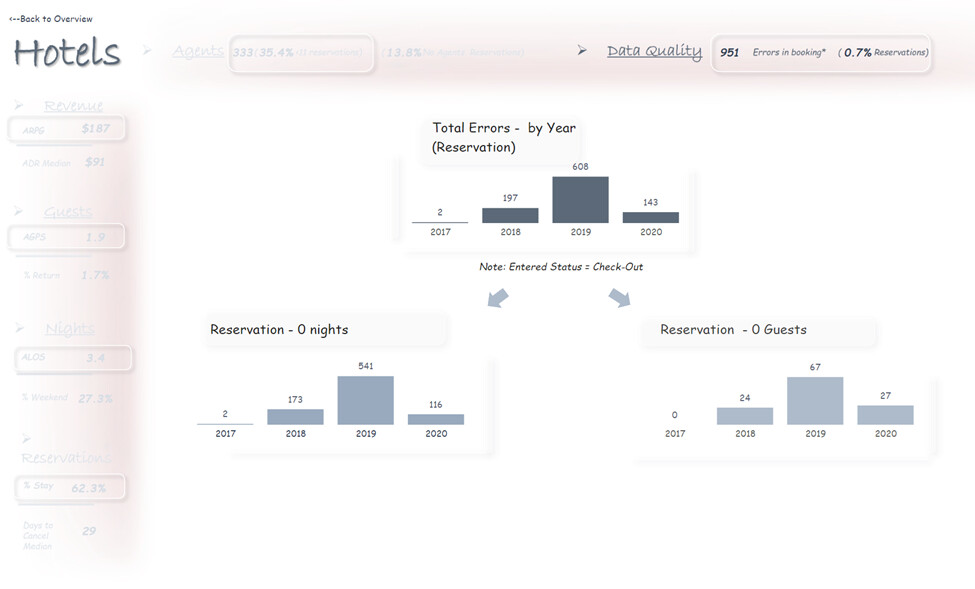
Data Quality

With 2 types that I found
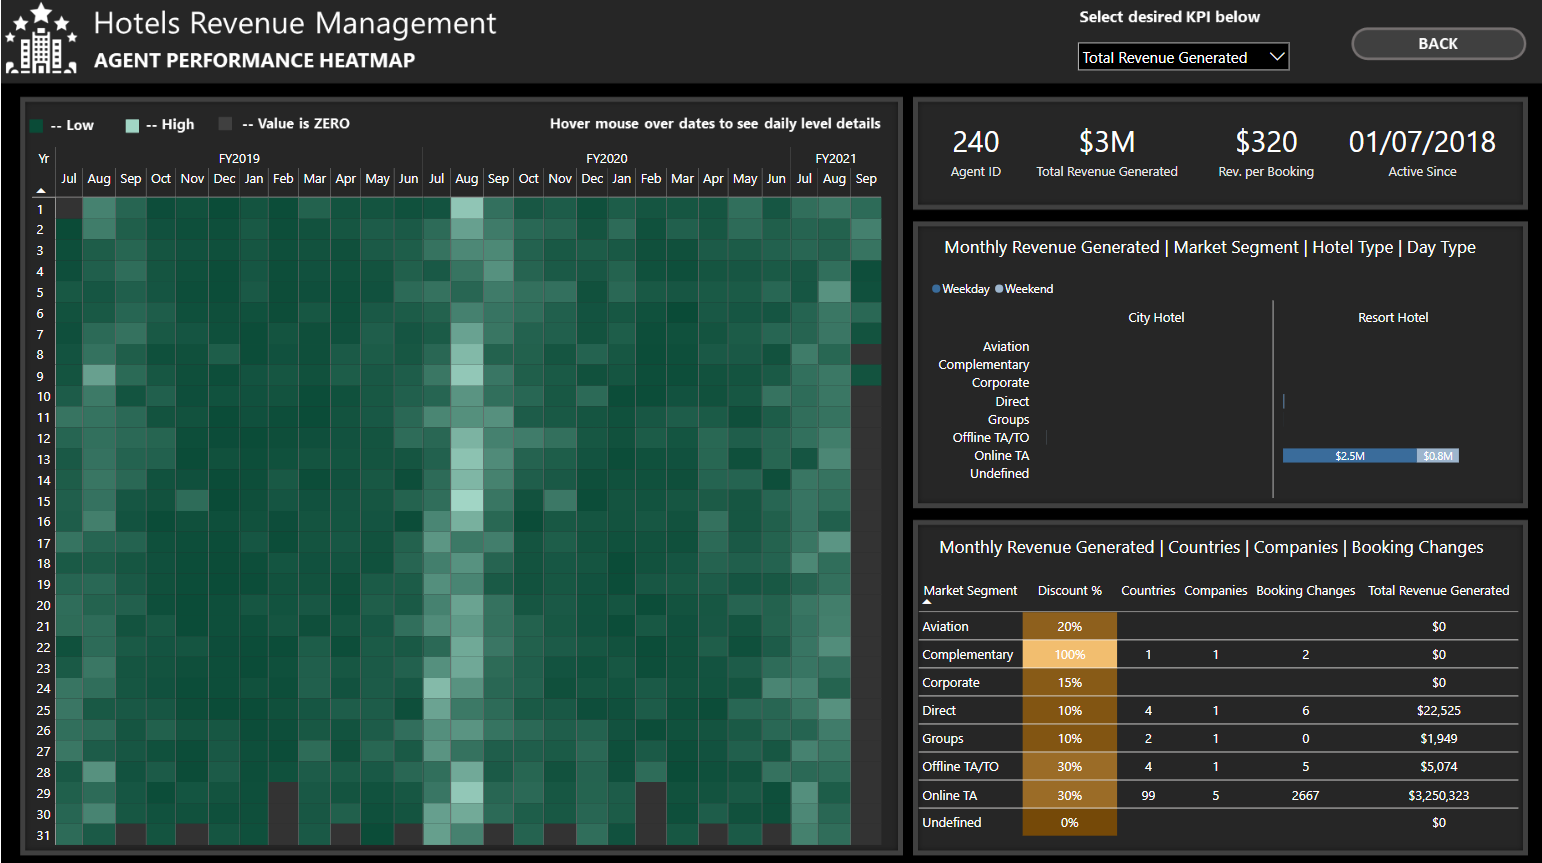
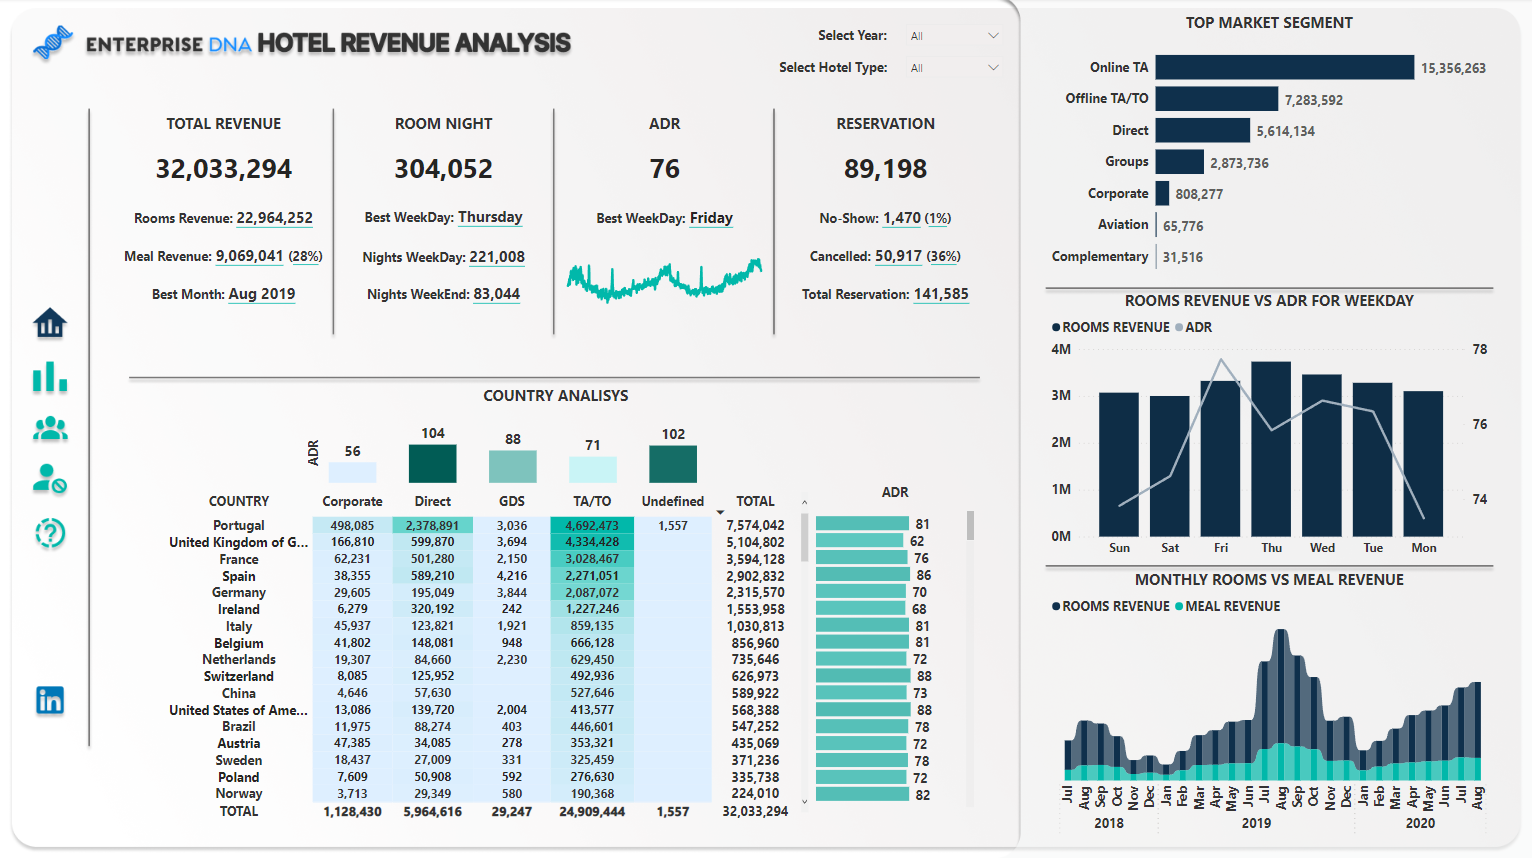
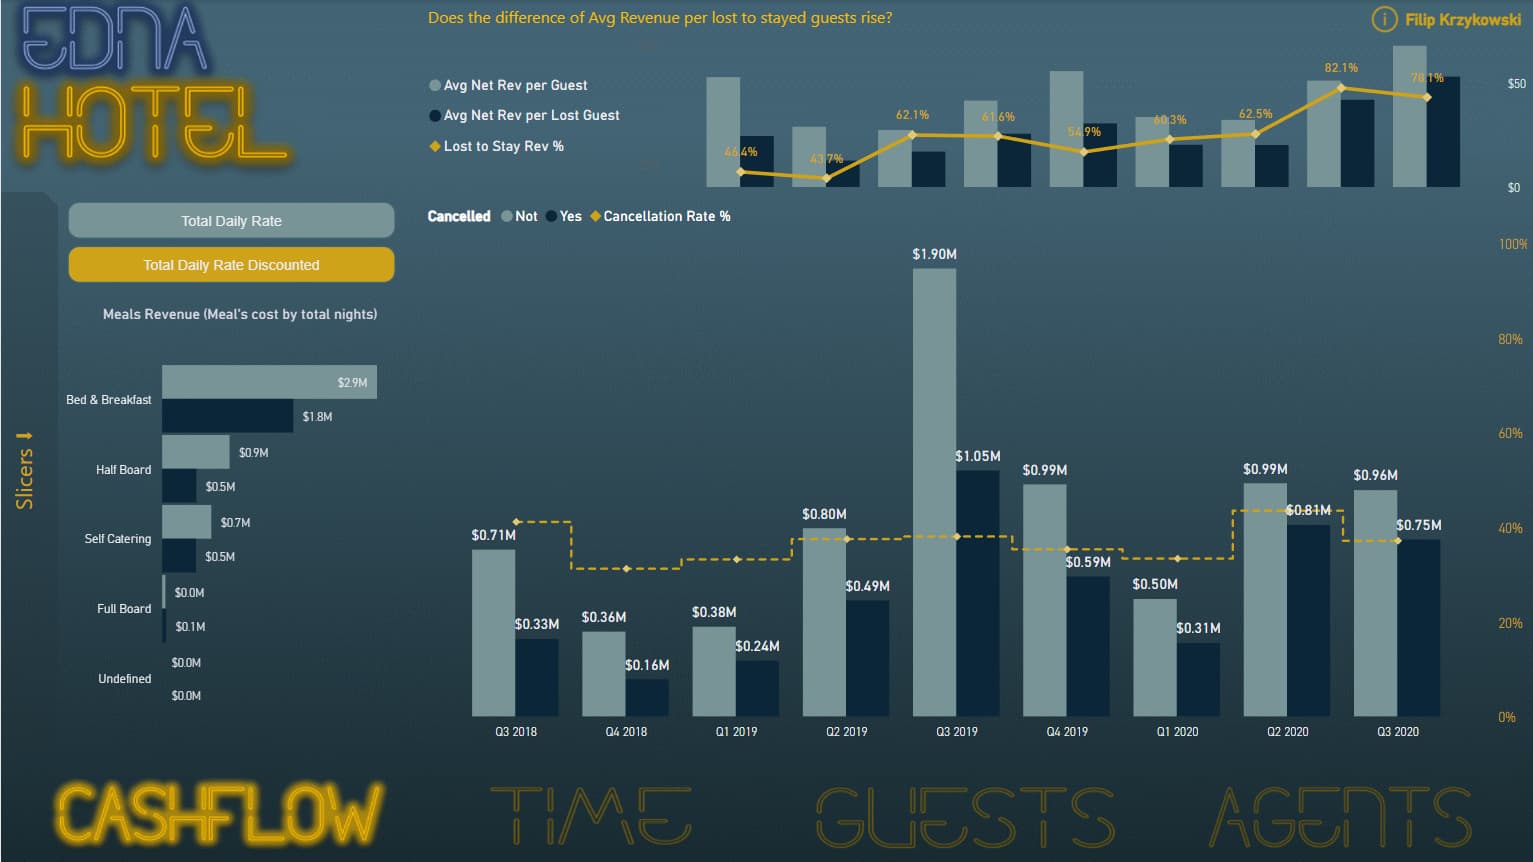
Revenue

I add this ‘summary book’ to show split by room and meal revenue + additional No Show and Non-Refund Cancellation

All charts dimensions are clickable and may use for filter.

Guests

Also ‘summary book’ to show split by new / return customers
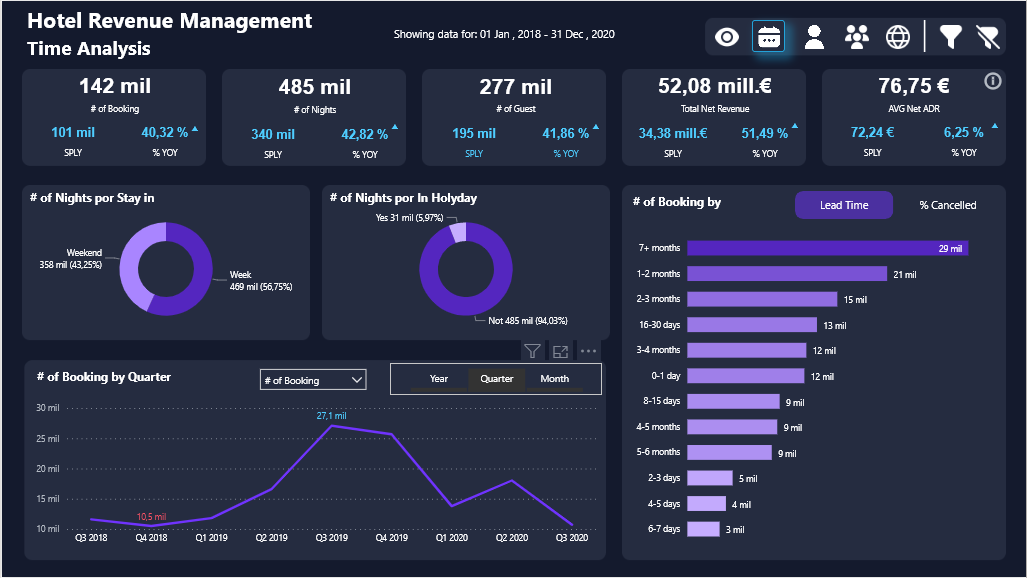
Nights

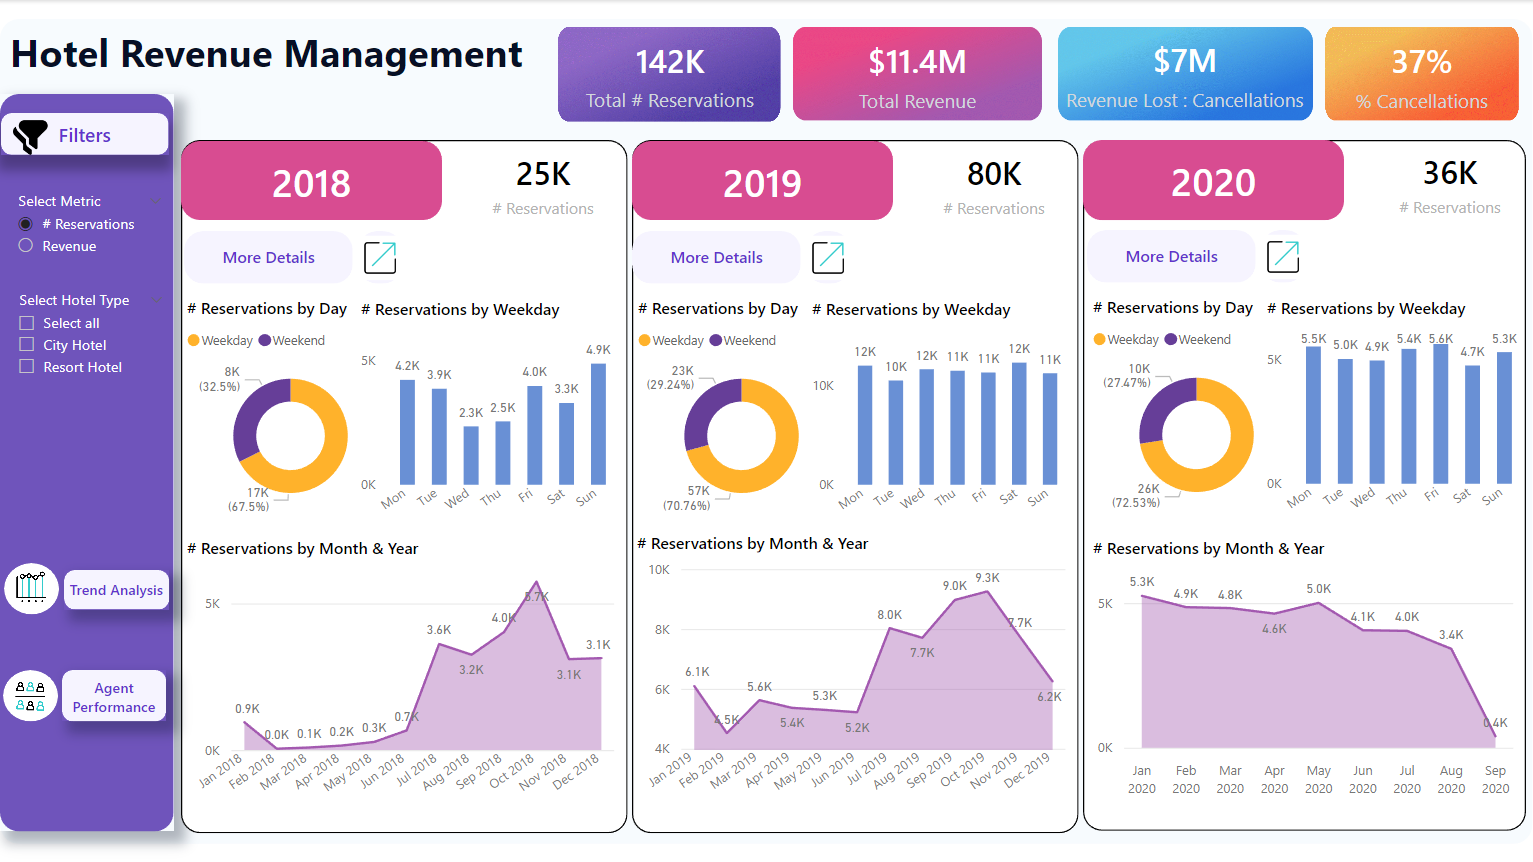
Also ‘summary book’ to show split by weekend / weekday

  • how much nights are only weekend and how much combined WE + WD
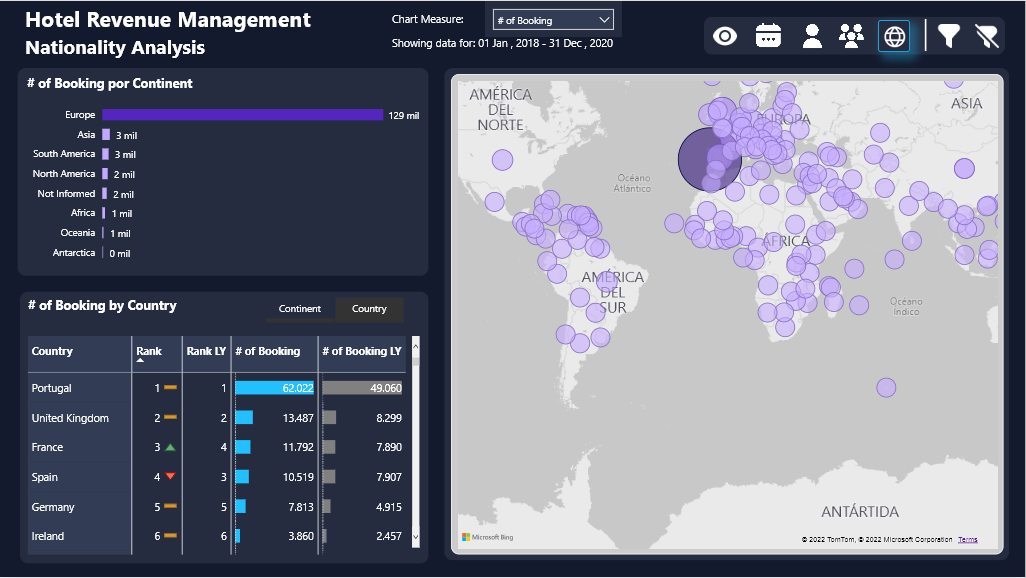
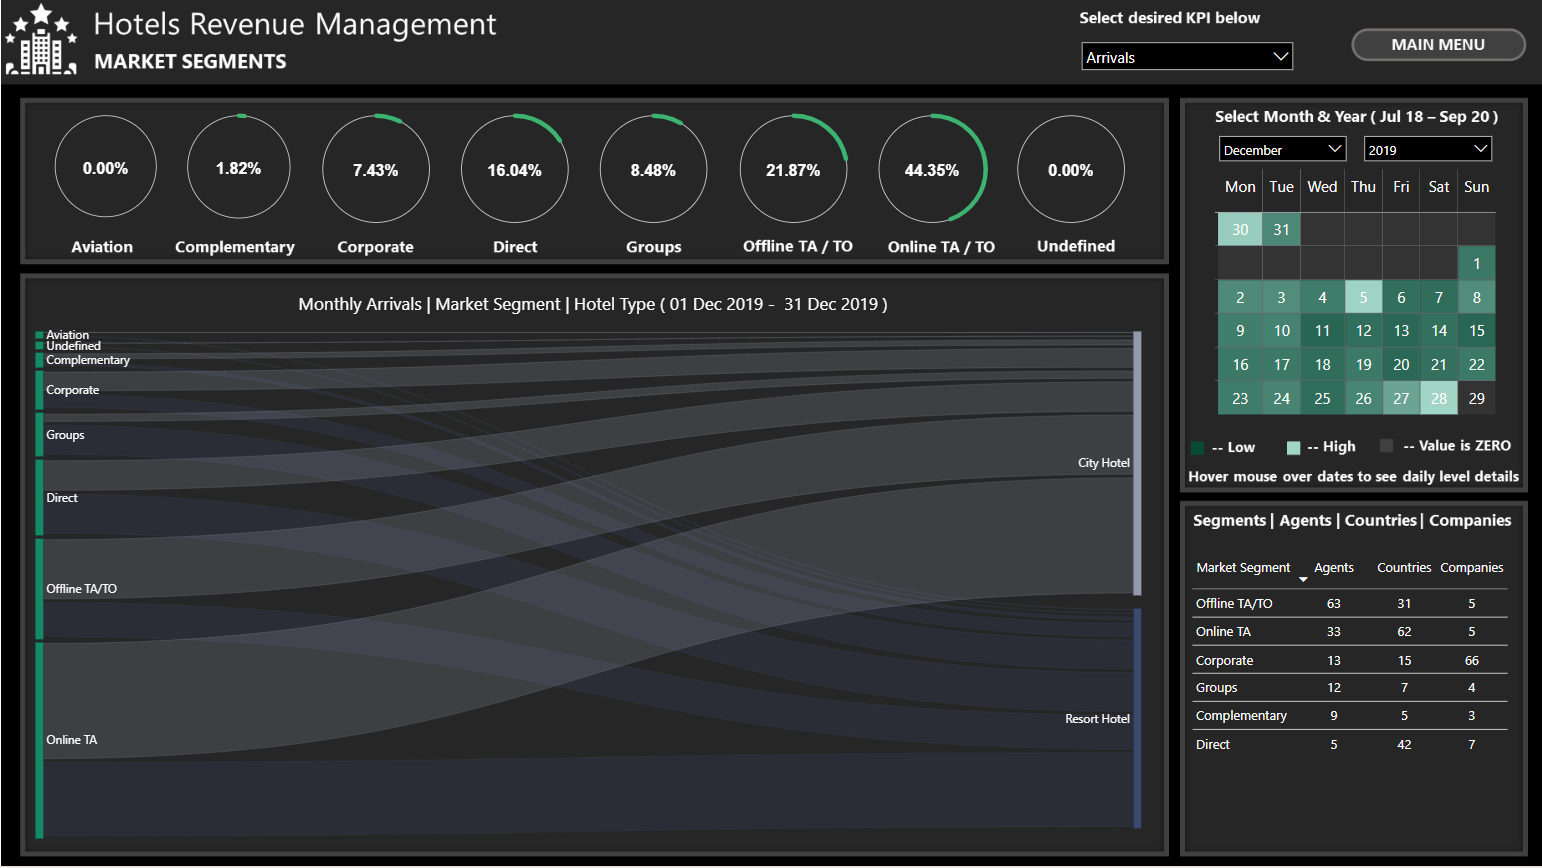
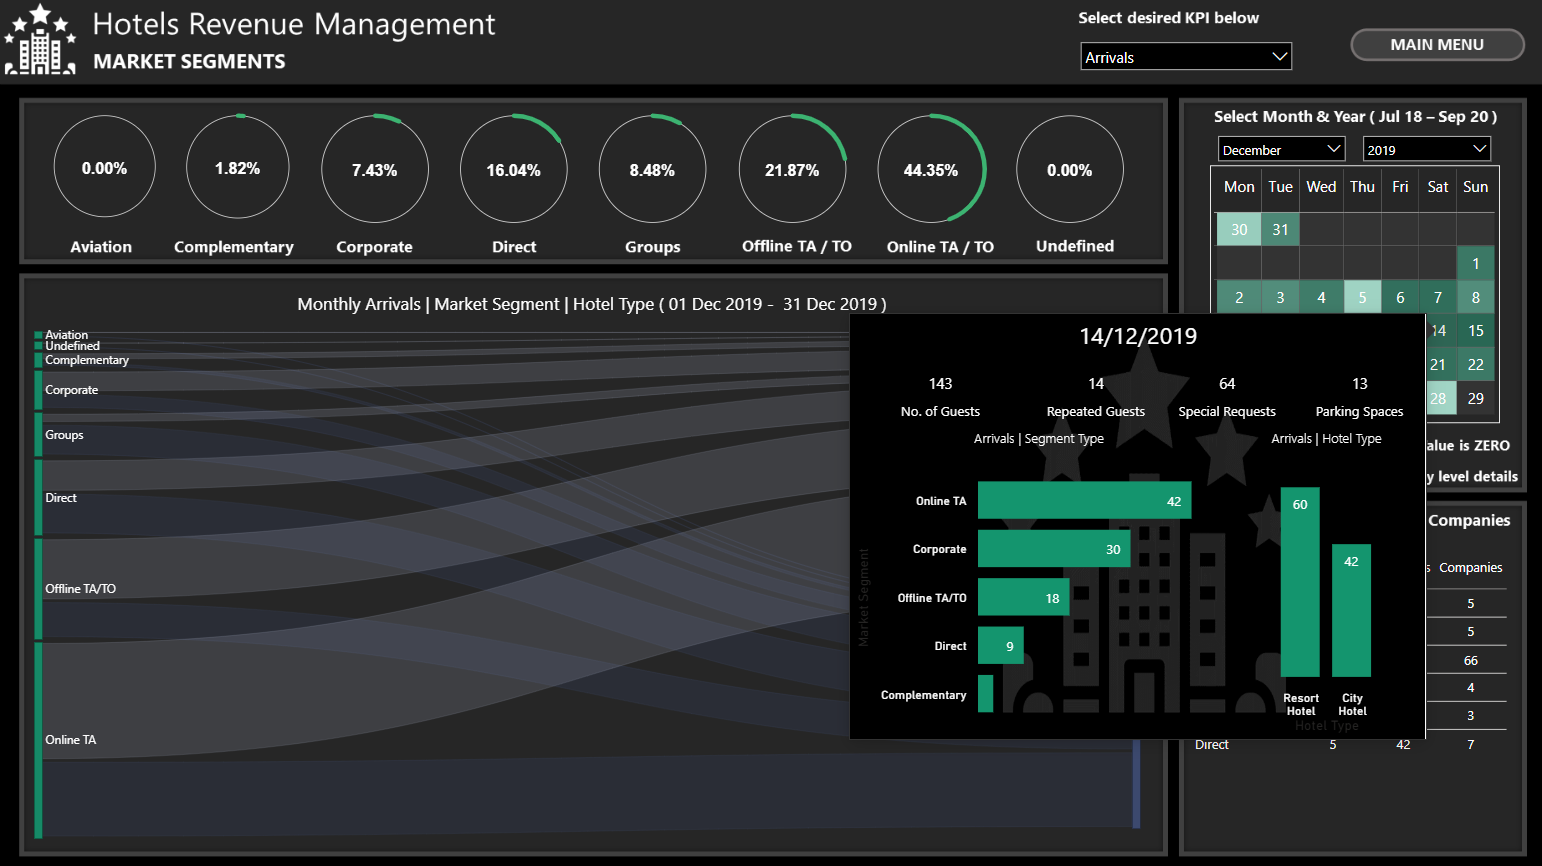
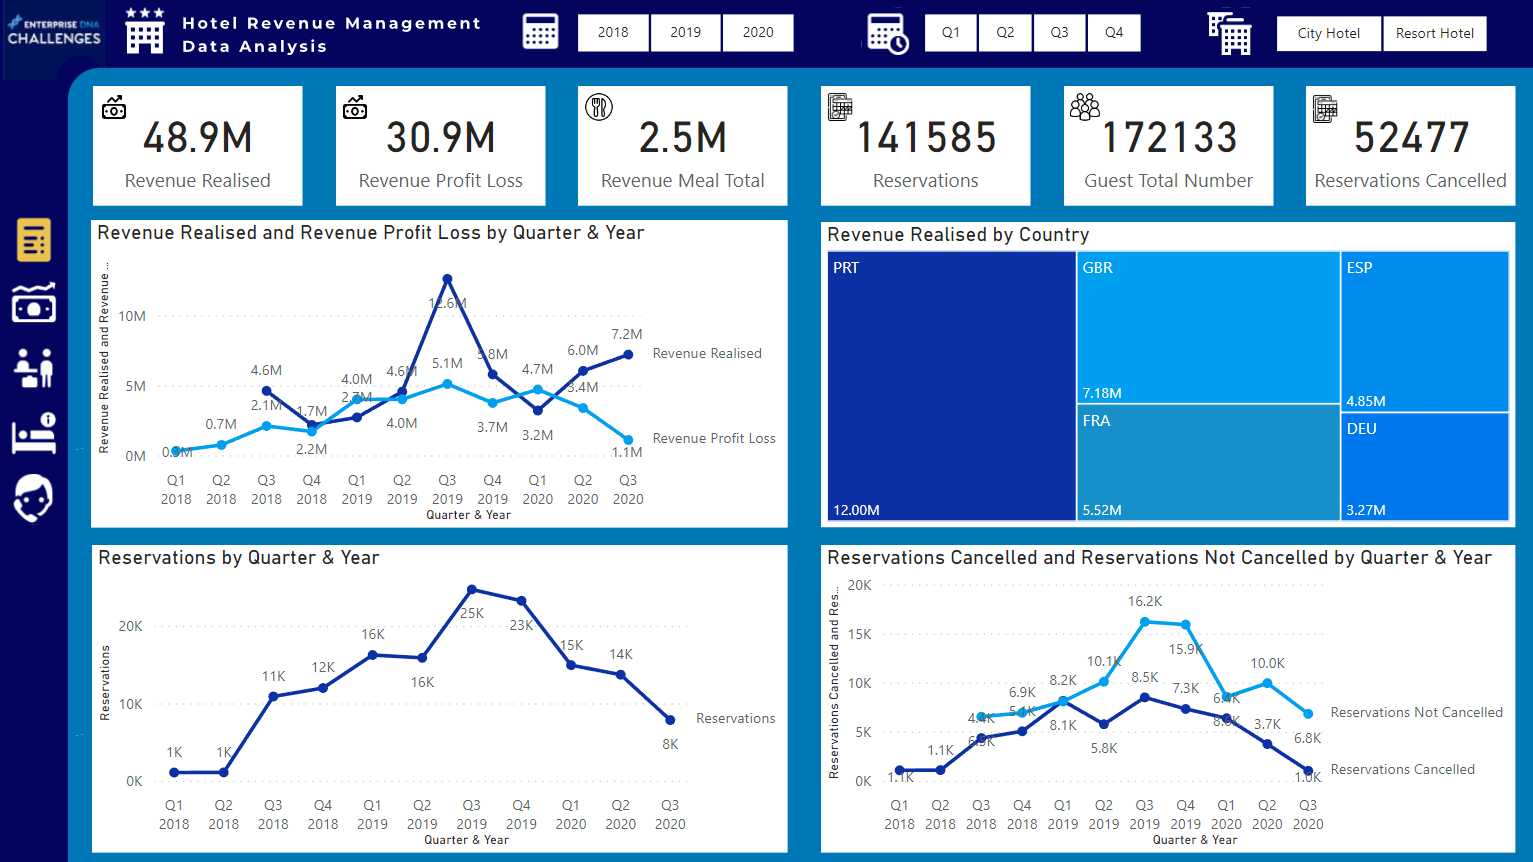
Reservations

Since there are so many countries – Top 20 and Pareto technique is used.
I also add lead time categories to see in which one are most cancellations.

Regarding color pallete I tried something new this time – I find inspiration in my Mom’s strawberry homemade ice cream and my Parents garden – blueberries, rasberries and blue geen shovel (with some minor adaptations in shades).

Link to full report:

What do you think?

Happy to have your comments and feedback.

Thank you.

Best regards,
Maja

4 Likes

Good morning to all,
This is my entry for EDNA Challenge 22: Hotel Revenue Management.

  1. General Overview

  1. Time Analysis

  1. Agent Analysis

  1. Guest Analysis

  1. Nationality Analysis

The link to the full report.

Good luck to all the participants and I hope you like it.

Regards,

7 Likes

Hi everyone

Here is our entry for EDNA Challenge 22 as Team MAK2.

Team Members are
Myself
@Wishal-Khalid
Nabeel Khalid
Umaima Mahmood

Nabeel and Umaima are not forum members and they participated as newcomers.

The various sections of the report with some snapshots are

  1. Executive Overview

  2. Customers


  3. Agents


  4. Market Segments


  5. Rooms


  6. Self Service KPI Insights

You can see and interact with the published report here

I will post a detailed development methodology later. Thanks to my entire team and thumbs up to the Head of Challenges @FPastor for another great challenge

Abu Bakar Alvi

6 Likes

Hi everyone.

This is my entry for this challenge. Thank you so much.

3 Likes

Hi everyone, how are you doing?
Please find below my entry for this challenge installment.

First of all, huuge congrats everyone - absolutely phenomenal reports, just mind blowing how quickly you raise a bar…Well done friends.

Here a brief description of my report:
Reversely to my previous report (challenge #21) I wanted to switch between my standard dark-themed dashboard to ligh-theme layout, with more simplistic report structure.

It’s a single page report (all made within one page), with three subpages (analyses) in total: main view, breakdown by agent, breakdown by localization. I leave some space for future further development. It was a really interesting database (congrats @FPastor, amazing challenge) and I would definitely like to put a few additional pages with different insights.

Some features implemented in the report:

View #1:
Overall view (timelines):

Two different slicer selections with several KPIs, that are separately displayed on two column charts. It leaves end-user with possibility to select and compare two different, relevant metrics.

Additionally, there is possibility to: a) change date granularity, b) display given constant line (either min, avg, max, some of them or none) and c) higlight lowest and highest value in respect to granularity and metric selection.

Bar chart (on the right side) allows to show two important metrics (in that scenario so called Gross Revenue and Net Revenue) on one chart, and with selected breakdown (by hotel type, segment, etc) - to give a quick insights. We can also choose whetever we want to show only PY values, only current values, YoY nominal variance or relative variance, all with different color formatting options.

We can also have two buttons (left/right arrows) to change so called “quick insights” (switching between views)

View #2: & View #3
Both views combine tabluar views (which shows aggregated value for given period for given category: localization or agent). It’s accompanied by small multiple column charts to display given localization or agents on timelines

I will be revealing more niuances along the way.
Below I’m sharing link to interactive version.

All best to everyone!


Przechwytywanie

9 Likes

Hi everyone, this is an entry submitted by Lindsay Kriss via email.

Here’s how Lindsay Kriss described it:

"I really enjoyed this challenge. It was a very interesting dataset with some interesting insights I didn’t expect. I approached this looking at it from how the company would increase future revenues and decrease cancellations/no-shows. "

You can view the full report here
Lindsay Kriss

Please feel free to give Lindsay Kriss your feedback on her report.

1 Like

Hi everyone, this is an entry submitted by Wanderson Barbosa via email.

Here’s how Wanderson Barbosa described it:

"I really enjoyed this challenge. It was a very interesting dataset with some interesting insights. I hope you like it."​

You can view the full report here
Wanderson Barbosa

Please feel free to give Wanderson Barbosa your feedback on his report.

1 Like

Hi everyone, this is an entry submitted by Azadeh​ Rad via email.

Here’s how Azadeh​ Rad described it:

I really enjoyed this challenge. It was a very interesting dataset with some interesting insights. I hope you like it. Thank you so much for providing this opportunity to practice."

You can view the full report here
Azadeh​ Rad

Please feel free to give Azadeh​ Rad your feedback on his report.

1 Like

Hi everyone, this is an entry submitted by Wan Teck Chung via email.

Here’s how Wan Teck Chung described it:

I really enjoyed this challenge. It was a very interesting dataset with some interesting insights. I hope you like it. Thank you so much for providing this opportunity to practice."​

You can view the full report here
Wan Teck Chung

Please feel free to give Wan Teck Chung your feedback on his report.

1 Like

Hi everyone, this is an entry submitted by Shamali Sawant via email.

Here’s how Shamali Sawant described it:

"I really enjoyed this challenge. It was a very interesting dataset with some interesting insights. I hope you like it. Thank you so much for providing this opportunity to practice."​

You can view the full report here
Shamali Sawant

Please feel free to give Shamali Sawant your feedback on her report.

1 Like

Hi everyone, this is an entry submitted by Solar Zhu via email.

Here’s how Solor Zhu described it:

“I really enjoyed this challenge. It was a very interesting dataset with some interesting insights. I hope you like it. Thanks to Federico and work with the error bars visualization tricks.”

You can view the full report here
Solar Zhu

Please feel free to give Solar Zhu your feedback on her report.

2 Likes

Hi everyone, this is an entry submitted by Argenis via email.

Here’s how Argenis described it:

“I really enjoyed this challenge. It was a very interesting dataset with some interesting insights. I hope you like it."

You can view the full report here
Argenis

Please feel free to give Argenis your feedback on her report.

1 Like

Hi everyone, this is an entry submitted by Sebastiaan Gaastra via email.

Here’s how Sebastiaan Gaastra described it:

“I really enjoyed this challenge. It was a very interesting dataset with some interesting insights. I hope you like it.”

You can view the full report here
Sebastiaan Gaastra

Please feel free to give Sebastiaan Gaastra your feedback on her report.

1 Like

Hi everyone, this is an entry submitted by Filip Krzykoski via email.

Here’s how Filip Krzykoski described it:

“In the report I have exploited the idea of field parameters as much as I could. When it comes to “twinkle” Logo it is a GIF Wallpaper for each page with Hotel Neon Theme. Hope you will like it.”

You can view the full report here
Filip Krzykoski

Please feel free to give Filip Krzykoski your feedback on her report.

1 Like

Hi everyone, this is an entry submitted by Muhammad Ahmed via email.

Here’s how Muhammad Ahmed described it:

"Please see my entry for Challenge 22. Excellent Dataset, I’ve learned a lot as always. Hope you like it."​

You can view the full report here
Muhammad Ahmed

Please feel free to give Muhammad Ahmed your feedback on her report.

1 Like

Hi everyone, this is an entry submitted by Pa Pa via email.

Here’s how Pa Pa described it:

“Please see my entry for Challenge 22. Excellent Dataset, I’ve learned a lot as always. Hope you like it.”

You can view the full report here
Pa Pa

Please feel free to give Pa Pa your feedback on his report.

2 Likes

Hi everyone, this is an entry submitted by Omar Sherif via email.

Here’s how Omar Sherif described it:

“It was an amazing experience and challenging in the same as i managed to complete it in 2 days! I performed a report doing customer analysis, revenue analysis, and Agents Performance Analysis”

You can view the full report here
Omar Sherif

Please feel free to give Omar Sherif your feedback on his report.

1 Like

Hi Enteprise on Demand Subscribers,

Enterprise DNA Challenge 22 is officially closed.

Another remarkable EDNA Challenge.

First and most important, we have reached over 2274 group members during data challenge 22!!

Let us revisit some highlights happened during Challenge 22:

Our data challenge hub grew up to 2274 members within 7 months.

We launched 40 + posts in EDNA Challenge Community Group.

We engaged 58,048 post views.

We interacted over 300 comments.

We accepted 51 finals entries.

Our participants have produced well 200+ analysis pages.

Our participants’ reports contain more 375+ DAX measures, well over 100+ Navigation buttons, Filed Parameters, Bookmarks and Tool tips.

The variety of native and customs visuals in the reports is a mastery of Data Visualization.

All highlights cannot be achieved without your dedication. You are the owner of our community; we love your passion and motivation on your data journey!

Welcome your invitations to your colleagues or friends, we can be better and stronger with more data friends!

Congratulations to all participants, you have done excellently well. Enterprise DNA thanks you for your efforts and dedication.

A round of applause to the Enterprise DNA Community Lead Team for a tremendous effort in the making and coordination of this challenges.

Let us say goodbye to Challenge 22 and wait for the winner announcement and Challenge 23 soon!

Federico Pastor
Head of Platform Experience and Data Challenges

Participant Entries_C22.pdf (6.0 MB)

1 Like

Really nice, clean report!

3 Likes