Hi everyone,
Below I explain the process followed for the development of the Hotel Revenue Management report:
DEVELOPMENT PROCESS HOTEL REVENUE MANAGEMENT
In the process of developing this report I have followed the following phases:
- Loading and Cleaning Data from Power Query
• First, we create a query called Data_Source that contains the path to the data source.
• 2018: Data from 2018. Created using Reference on Data_Source and selecting the 2018 tab.
• 2019: Created using Reference on Data_Source and selecting the 2019 tab.
• 2020: Created using Reference on Data_Source and selecting the 2020 tab.
• Dim_Market_Segment: Created using Reference on Data_Source and selecting the market_segment tab.
• Dim_Meal_Cost: Created using Reference on Data_Source and selecting the meal_cost tab.
• Hotel_Revenue_RAW: We combine the 2018, 2019 and 2020 queries.
Before combining them, we make sure they have the same number of columns and they have the same name. In the case of the 2018 table, there is a column called “AVG Daily Rate” and in the other two tables it is called “adr”, so they are unified to AVG Daily Rate.
• Dim_Hotel_Type: Created using Reference on Hotel_Revenue_RAW.
• Dim_Country: Created using Reference on Hotel_Revenue_RAW.
- In order to show the photo of the flag of each country, we use the table in Excel Countries with flags:
- To segment the data by the Continent of each country, we use the Countries by ISO table, which has the following web address: https://www.geonames.org/countries/
- To the Countries by ISO table, we add the information of the photo of the flag contained in Countries with flag.
- Finally, we add the information from this table to the Dim_Country table
• Dim_Distribution_Channel: Created using Reference on Hotel_Revenue_RAW.
• Dim_Reserved_Room_Type: Created using Reference on Hotel_Revenue_RAW.
• Dim_Assigned_Room_Type: Created using Reference on Hotel_Revenue_RAW.
• Dim_Deposit_Type: Created using Reference on Hotel_Revenue_RAW.
• Dim_Agents: Created using Reference on Hotel_Revenue_RAW.
• Dim_Companies: Created using Reference on Hotel_Revenue_RAW.
• Dim_Customer_Type: Created using Reference on Hotel_Revenue_RAW.
• Dim_Reservation_Status: Created using Reference on Hotel_Revenue_RAW.
• One of the requirements of the report is to analyze the information by holiday periods, so I have created the fxHolidays function that, based on the country and year code, obtains the national or national and local holidays.
This is the code in the Advanced Editor:
let fnHolidaysTable = (Country as text, Year as text, OnlyNationalHolidays as number) as table =>
    let
        _National_Holidays = if OnlyNationalHolidays = 1 then "national-holidays/" else "",
        Source = Web.BrowserContents("https://www.whenonearth.com/calendar/"&Country&"/"&_National_Holidays&Year),
        #"Extracted Table From Html" = Html.Table(Source, {{"Column1", ".day"}, {"Column2", ".day + *"}, {"Column3", ".desc"}}, [RowSelector=".hdays TR"])
    in
        #"Extracted Table From Html",
      Documentation = [
      Documentation.Name =  " fxHolidays",
      Documentation.Description = " Date table function to create table with all holydays or only the nationals one for a Country and Year ",
      Documentation.LongDescription = " Date table function to create table with all holydays or only the nationals one for a Country and Year ",
      Documentation.Category = " Table",
      Documentation.Version = " 1.00: full code review",
      Documentation.Source = " local",
      Documentation.Author = " José Antonio Fernández Puga",
      Documentation.Examples = { [Description =  " See: https://www.whenonearth.com/calendar to see the available values for the Country and Year parameters ",
        Code = " fxHolidays ( ""united-kingdom"", 2018, 1 ) //Only national holidays"
        &Character.FromNumber(13)&Character.FromNumber(10)&" fxHolidays ( ""united-kingdom"", 2018, 0 ) //All holidays ... ",
        Result = " " ] }
      ]
  in
  Value.ReplaceType( fnHolidaysTable, Value.ReplaceMetadata( Value.Type( fnHolidaysTable ), Documentation ))
• The Holydays table contains the national holidays of united-kingdom for the years 2018 to 2020.
We join this table to Dim_Dates to add the Holiday Name column.
• Dim_Dates: Table of EDNA dates that is contained in the .pbit file, from which we create the report.
We have created it with the following call, in which we pass the Holidays[Date] field as the third parameter:
fxDates(fxStartDate, fxEndDate, 1, Holidays[Date], 1)
We add the following columns:
- Holiday Name from the Holidays table
- InHoliday: Yes/Not
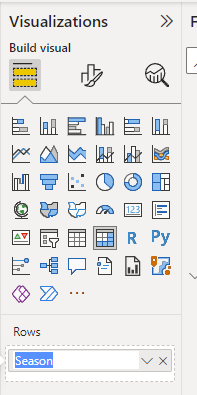
- Season: Spring/ Summer/ Autumn/ Winter
- Stay in: Week/Weekend
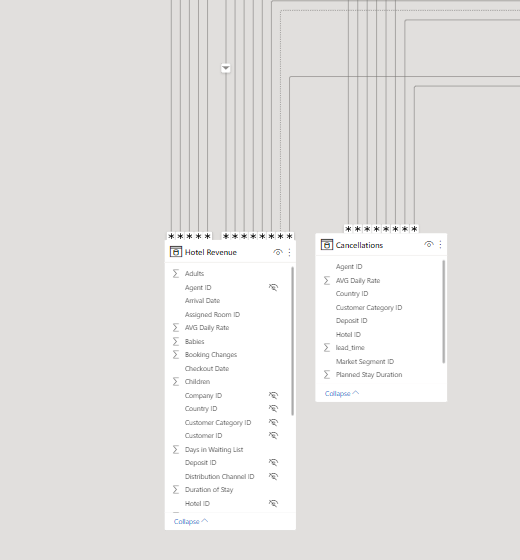
• Fact_Hotel_Revenue: Fact table created using Reference on Hotel_Revenue_RAW.
-
Joins with each of the dimension tables we created earlier as a reference to Hotel_Revenue_RAW, leaving only the primary key fields in the fact table.
-
The following columns are added:
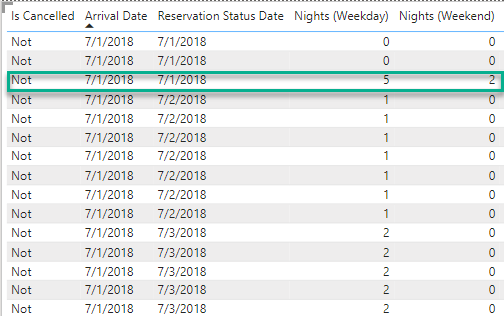
Nights: [Nights in Weekend] + [Nights in Week]
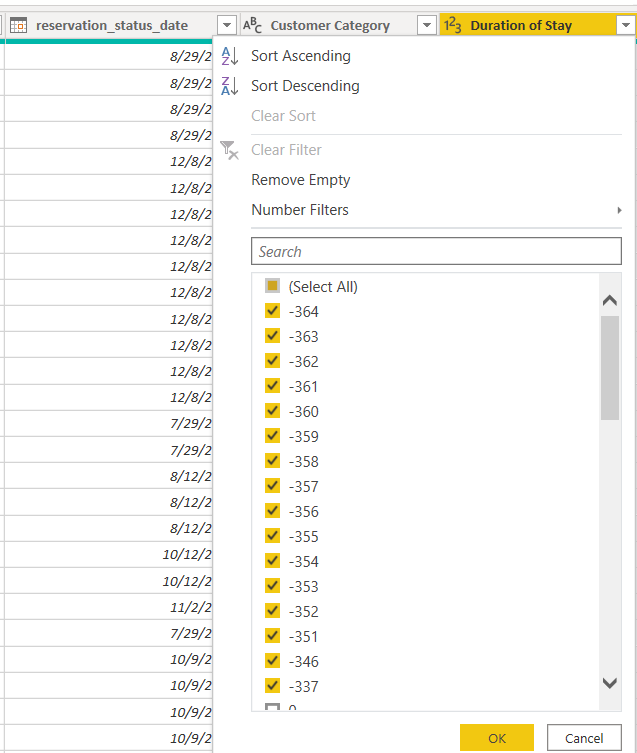
Reservation Date: Date.AddDays( [Arrival Date], -1 * [Lead Time] )
Departure Date: Date.AddDays( [Arrival Date], [Nights] )
-
I have followed the approach of generating a record for the day of the stay and basing the calculations of time on the date of the stay instead of taking only the arrival date of the reservation, since it facilitates the temporal analysis, although it increases the size of the data set.
To do this, we add an index to the table and create a column by calling the fxCreatePeriodTable function:
let
Source = (StartDate as date, EndDate as date) as table =>
let
DayCount = Duration.Days(EndDate-StartDate)+1,
DateList = List.Dates(StartDate,DayCount,#duration(1,0,0,0)),
AddPeriodName = List.Transform(DateList,
each {_}),
CreateTable = #table(
type table[ Date=date],
AddPeriodName)
in
CreateTable
in
Source
We create a table with the days between the arrival date and the departure date:
Table.AddColumn(#"Added Index", "Days of Stay", each fxCreatePeriodTable([Arrival Date], if [Nights] > 0 then Date.AddDays( [Departure Date], - 1 ) else [Arrival Date] )),
- Añadimos una columna con Guest Type:
Table.AddColumn(#"Changed Type1", "Guest Type",
    each if ([Childrens] + [Babies]) = 0 and [Adults] = 1 then "Singles" else
    if ([Childrens] + [Babies]) = 0 and [Adults] = 2 then "Couples" else
    if ([Childrens] + [Babies]) > 0 then "Families"
    else "Groups")
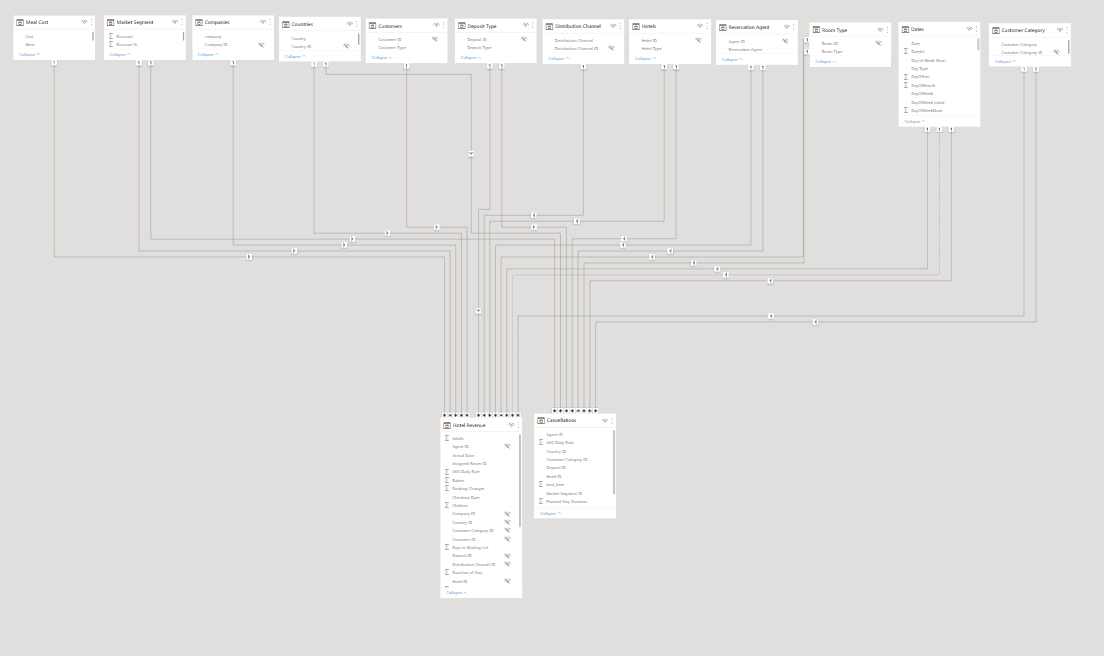
- Data Modeling
• I have followed the Star Scheme to model the data.
• For its graphical representation I have used the cascade design.
- Creating DAX Measures
• All measures have been organized in folders within the Key Measures and Report Measures tables.
• Some main measures:
- # of Booking = DISTINCTCOUNT( Fact_Hotel_Revenue[Index] )

-	Room Gross Revenue = SUM( Fact_Hotel_Revenue[AVG Daily Rate] )

-	Room Discount = SUMX( Fact_Hotel_Revenue, [AVG Daily Rate] * RELATED( Dim_Market_Segment[Discount] ) )

-	Room Net Revenue = [Room Gross Revenue] - [Room Discount]


-	Meal Revenue = SUMX( Fact_Hotel_Revenue,
-	 (Fact_Hotel_Revenue[Adults] + Fact_Hotel_Revenue[Childrens]) * RELATED( Dim_Meal_Cost[Meal Cost] )  )

-	Total Net Revenue = [Room Net Revenue] + [Meal Revenue]


-	AVG ADR = AVERAGE( Fact_Hotel_Revenue[AVG Daily Rate] )

-	AVG Net ADR = AVERAGEX( Fact_Hotel_Revenue, [AVG Daily Rate] * ( 1 - RELATED( Dim_Market_Segment[Discount] ) ) )


-	AVG ADR Discount = [AVG ADR] - [AVG Net ADR]

-	# of Nights =
SUMX( SUMMARIZE( Fact_Hotel_Revenue,
      Fact_Hotel_Revenue[Index] ,
     "Nights", MAX( Fact_Hotel_Revenue[Nights] ) ) ,
     [Nights] )
-	# of Adults =
SUMX(
      SUMMARIZE( Fact_Hotel_Revenue,
      Fact_Hotel_Revenue[Index],
     "Adults", MAX( Fact_Hotel_Revenue[Adults] ) ),
     [Adults] )

-	# of Childrens =
SUMX(
      SUMMARIZE( Fact_Hotel_Revenue,
      Fact_Hotel_Revenue[Index],
     "Childrens", MAX( Fact_Hotel_Revenue[Childrens] ) ),
     [Childrens] )
-	# of Babies =
SUMX(
      SUMMARIZE( Fact_Hotel_Revenue,
      Fact_Hotel_Revenue[Index],
     "Babies", MAX( Fact_Hotel_Revenue[Babies] ) ),
     [Babies] )

-	# of Guest = [# of Adults] + [# of Childrens] + [# of Babies]

-	# of Agents = CALCULATE( DISTINCTCOUNT( Fact_Hotel_Revenue[Agent Key] ), Dim_Agents[Agent Code] <> 0 )
- UI design
The report consists of the following screens:
•General Overview
- In this Overview screen, we have at the top the main KPIs in which the current value and the value of the same period in the previous year are compared, showing the % change and applying conditional formatting.
For the Net KPIs, we have a Tooltips in the information icon with the breakdown of the gross amount and the discount.
-
We can select the measure that we want to show in the graphs in the Chart Measure slicer. For this, the PrmMeasures field parameter has been used.
-
The donut graph that shows the measure for Canceled has a tooltip for Reservation Status.
-
In the clustered column chart, we compare the current value with last year’s value.
The current value is represented in the chart columns and last year’s value as error bars. I have opted for this configuration to be able to have the tooltips when there is no information from last year, since with the error bars the tooltip is not shown.
We can view the information by Year, Quarter or Month by using the PrmDimDate field parameter.
The legend is made with a 100% Stacked Column Chart.
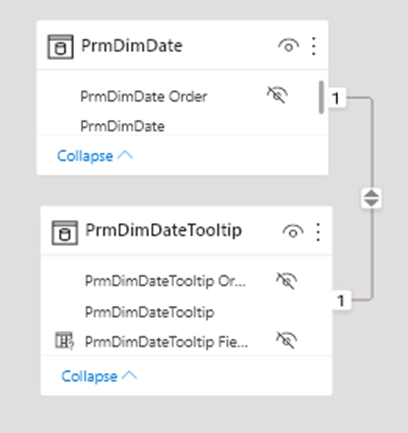
The tooltip displays the same information but for a lower level in the chart hierarchy: Quarter, Month, and Day. If we are viewing the information by month, the tooltip shows us the information by day for that month.
The PrmDimDateTooltip field parameter has been used which is related to PrmDimDate by the Order column.
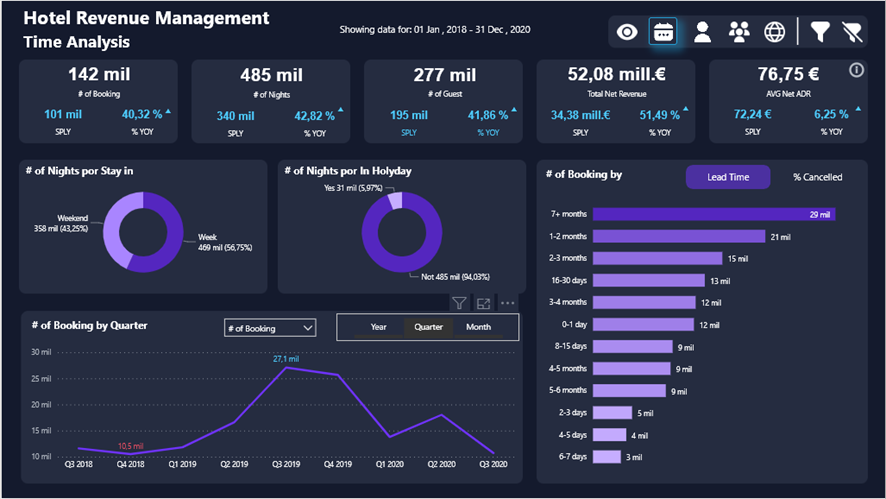
• Time Analysis
- In the Time Analysis screen we show the main KPIs at the top.
- Donuts graph to show the Number of Nights per Week or Weekend.
It has a tooltip to display the information by the days of the week.
- Donut chart to segment nights into Holidays or not.
It has a tooltip to break down the information by the holiday or the day of the week.
- Line graph in which we can see the trend of the selected measure by Year, Quarter or Month.
The maximum and minimum value of the measurement is shown in green and red respectively.
It has a tooltip to see the trend at a lower level of the Year, Quarter and Month hierarchy.
- Bar graph to see the Number of Reservations according to the groups created for the Lead Time.
Two columns have been created in the Fact_Hotel_Revenue table to be able to filter the report by these groups:
LeadTimeGroup Key = CALCULATE(
     VALUES( LeadTimeGroups[Index] ),
     FILTER( LeadTimeGroups,
     Fact_Hotel_Revenue[Lead Time] >= LeadTimeGroups[Min] &&
     Fact_Hotel_Revenue[Lead Time] <= LeadTimeGroups[Max] )
)

LeadTimeGroup Name = CALCULATE(
     VALUES( LeadTimeGroups[Group] ),
     FILTER( LeadTimeGroups,
     Fact_Hotel_Revenue[Lead Time] >= LeadTimeGroups[Min] &&
     Fact_Hotel_Revenue[Lead Time] <= LeadTimeGroups[Max] ))
- 100% Stacked Bar Chart to show the Number of Reservations according to the groups created for the Lead Time and if they are canceled or not.
Using Bookmark to toggle between both charts.
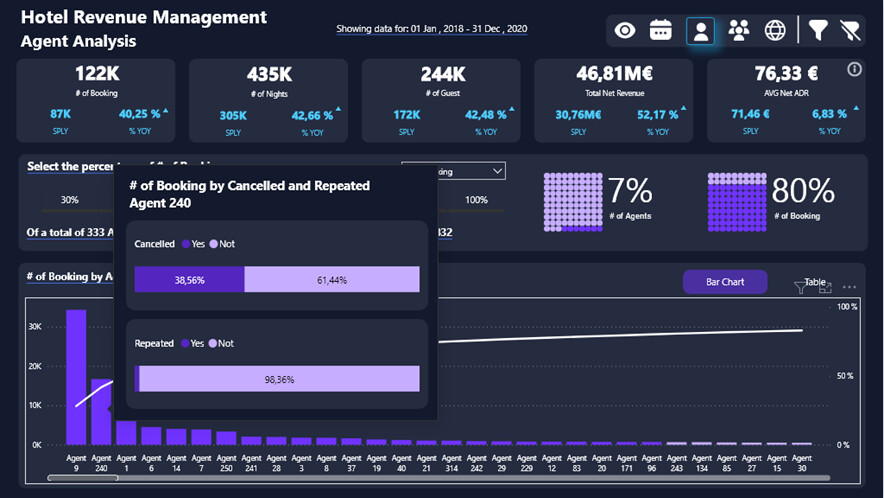
• AgentAnalysis
- In the Agent Analysis screen, we show the KPIs at the top. These KPIS are calculated for those records that have an agent.
# of Booking with Agent =
 CALCULATE( [# of Booking], Dim_Agents[Agent Code] <> 0 )
- Dynamic Pareto chart for the selected measure.
We can indicate the % that we want to analyze and it shows us the % of Agents that have contributed to this percentage.
For this %, the Prm%Pareto support table has been used:
The % Slicer has the following filter Filter Prm%Pareto is 1 to show those % greater than or equal to the percentage of the agent with the highest value.
Filter Prm%Pareto =
IF( ROUND( [Prm%Pareto Value], 2 ) >= ROUND([% Pareto First Agent], 2 ), 1, 0 )

% Pareto First Agent =
VAR _VirtualTable = ADDCOLUMNS(
    ALLSELECTED( Dim_Agents ),
    "@Measure", [Selected Agent Measure],
    "@PorcPareto", [% Pareto Selected Agent Measure]  )
VAR _Result = MAXX( TOPN( 1, _VirtualTable, [@Measure], DESC), [@PorcPareto] )
RETURN _Result
- The Enlighten Waffle Chart custom object has been used to show the % of Agents and the % selected.
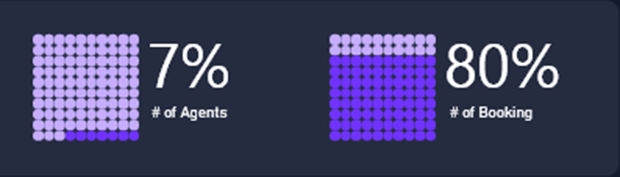
- Smart Narrative that shows the Number of total Agents, Number of Agents that have contributed to the selected % and value obtained.
Text Agent Pareto =
VAR _SelectedMeasure = MAX( PrmAgentMeasures[PrmAgentMeasures] )
VAR _Result = "Of a total of "&
    FORMAT( [# of Agents], "#,###" ) &
    " Agents, "&
    FORMAT( [# of Agent Selected Agent Measure], "#,###" ) &
    " Agents represent " &
    FORMAT( [Prm%Pareto Value], "###%" ) &
    " of " &
    _SelectedMeasure &
    ", with a value of "&
    [Txt Value Selected Measure with Agent % Pareto]
 RETURN _Result
- The Pareto chart has conditional formatting to highlight the agents that have contributed the selected %.
- It has the following tooltip to show the information if it is canceled or not and if it is about repeating guests or not.
- We can see the information of the agents in table format, which shows the ranking, measurement, % change, ADR and Canceled for the current and previous year.
To display these measurements in the table, the following related field parameters have been created:
•Guest Analysis
On the Guest Analysis screen we show the KPIs at the top.
In the # of Guest KPI I have added a tooltip that shows their distribution in Adults, Children and Babies using the HTML Content custom visual and the measure developed by Jefferson Alves:
Image Adults =

/*
Código desenvolvido por Jefferson Alves - Dados Criativos

Me siga nas Redes Sociais

Instagram: @dadoscriativos_
https://www.instagram.com/dadoscriativos_/

Linkedin: Jefferson Alves
https://www.linkedin.com/in/jeffersonallvesneves/

Youtube: Jefferson Alves - Dados Criativos
https://www.youtube.com/c/JeffersonAlvesDadosCriativos

*/


Var vPorcentagem = [% of Adults]

Var vOpacidade = 0.2

Var vImagem = "https://i.ibb.co/WBJB9LR/couple.png"

Return


"
<style>.conteiner{ position: relative; width: 100vw; height: 100vh; display: flex; justify-content: center; align-items: center; } .img_1, .img_2 {position: absolute;width: 90%;height: 90%;opacity: "& FORMAT( vOpacidade, "0.0", "en-US")  &";}.img_2{opacity: 1;clip-path: polygon(0 var(--porcentagem), 100% var(--porcentagem), 100% 100%, 0 100%);animation: anima_img 1s linear forwards;}@keyframes anima_img{from{clip-path: polygon(0 100%, 100% 100%, 100% 100%, 0 100%);} to{" & Var vPercentual =  ROUND( vPorcentagem * 100, 0)Var vResultado = SWITCH( TRUE(), vPercentual > 100, 0,vPercentual < 0, 100,100 - vPercentual )Return"clip-path: polygon(0 "& vResultado & "%, 100%  "& vResultado & "%, 100% 100%, 0 100%);}} </style> <div class='conteiner'> <img src='" & vImagem & "' class='img_1'> <img src='" & vImagem& "' class='img_2'> </div>
"
- Column chart by guest type: Singles, Couples, Families and Groups.
- Column chart by Client Type: Transient, Transient-Party, Contract and Group.
- Column Chart by Length of Stay Group:
In the Fact_Hotel_Revenue table, two columns have been added to be able to filter by the Length of Stay Group:
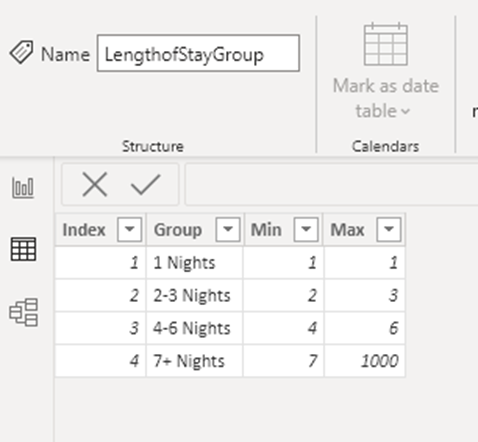
LengthofStayGroup Key = CALCULATE(
     VALUES( LengthofStayGroup[Index] ),
     FILTER( LengthofStayGroup,
     Fact_Hotel_Revenue[Nights] >= LengthofStayGroup[Min] &&
     Fact_Hotel_Revenue[Nights] <= LengthofStayGroup[Max] )
)

LengthofStayGroup Name = CALCULATE(
     VALUES( LengthofStayGroup[Group] ),
     FILTER( LengthofStayGroup,
     Fact_Hotel_Revenue[Nights] >= LengthofStayGroup[Min] &&
     Fact_Hotel_Revenue[Nights] <= LengthofStayGroup[Max] )
)
• NationalityAnalysis
- In the Nationality Analysis screen we show a bar graph by Continent.
- Table that we can see by Continent or by Country with the ranking information and the value of the selected measure for the current year and for the previous year.
- On the map we represent the color of the bubbles with a gradient according to the value of the selected measure.
It has a tooltip in which we show the information of the selected country: Flag, Name, the month and the season with the highest value of the measure along with the monthly distribution.
Regards,


 .
.