Builds 21 - "Enterprise DNA YouTube Channel Data Analysis"

@FPastor

Hello All,

WELCOME TO CHALLENGE 21.

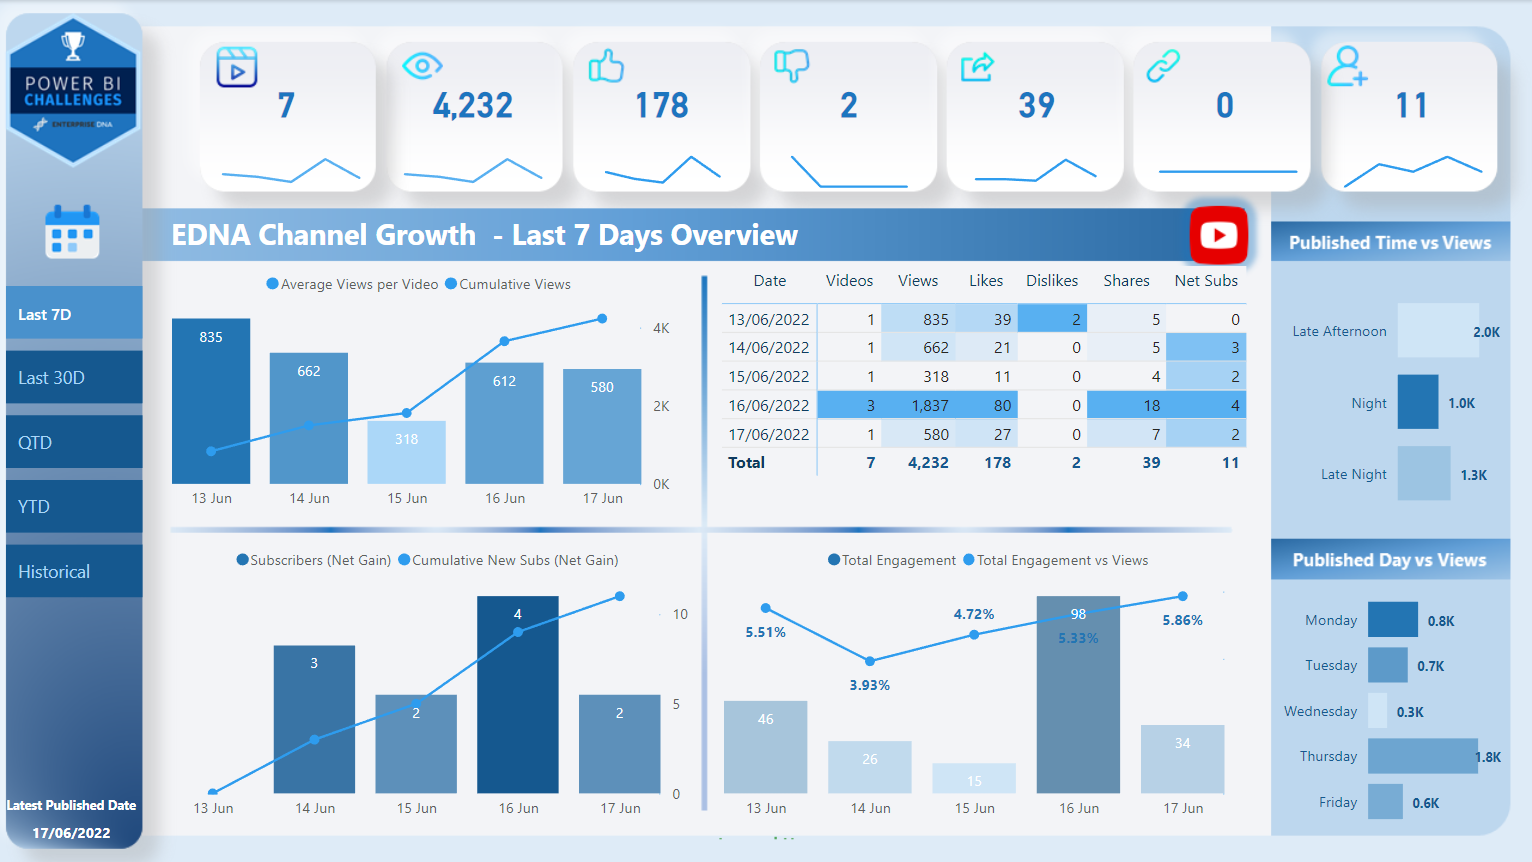
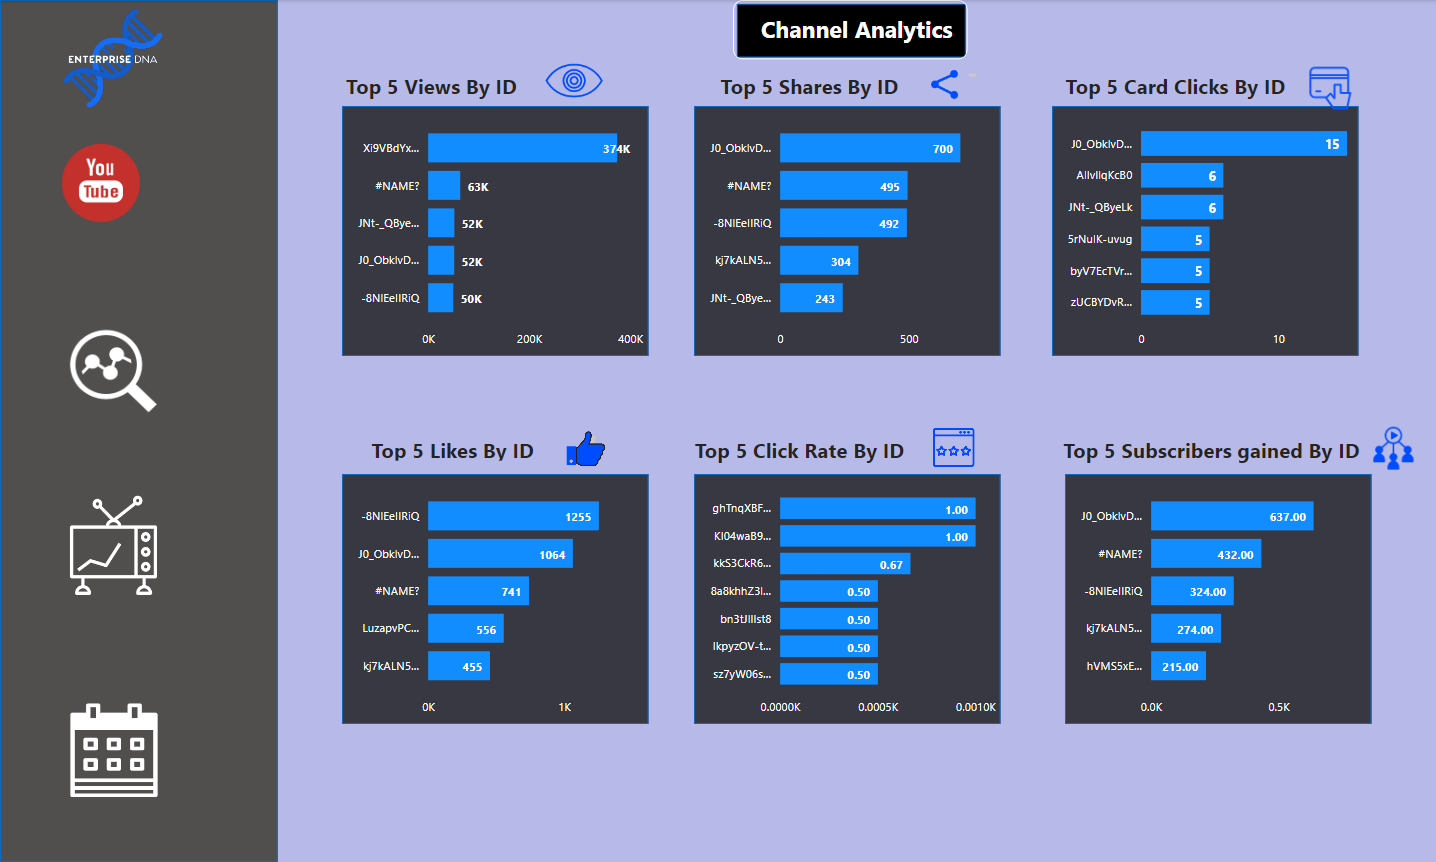
“EDNA YouTube Channel Data Analysis”

We are excited to introduce Challenge 21 now!

Challenge 20 “ Sales and Production Analysis ” was succeeded by 47 entries, 200+ analysis pages, 600+ DAX measures, and 400+ Navigation buttons, bookmarks, and Tooltips. Thanks for everyone’s engagement and dedication.

We always welcome more data friends join our group, please see below link:

Administration

We have great administration supporting the challenge via our forum. To learn more about it, please see the link below:

Check out the previous challenge entries here:

While the learning and experience of participating in the challenge is extremely rewarding itself, we also have some great prizes on offer for category winners. Please see below the categories.

Overall, Winner - all entrants are eligible.

First Time Participant winner - open to any Enterprise DNA member who is taking part in the challenge for the first time.

Winning Non-member - open to entrants not currently eDNA members.

Out of the Box Thinker - for those digging deep into their analysis.

Creative Head - for those bringing a bit of extravagance into their report and analysis.

Prizes

There are some excellent prizes on offer from free membership (for all category winners) and more – much more!!

Free Subscriptions to Enterprise DNA Learning Platform

Other prizes.

And much more…

The chance to have your work showcased across the Enterprise DNA network.
The chance to win complimentary membership.
Receive personalized feedback around your development.
Learn from peers and experts.
Practice what the workplace is looking for enhancing your credentials as a Power BI expert.
Get experience across different industries.
Understand common pitfalls in solutions.
Get involved in discussions around enhancing your solutions and learn about new features.

Federico Pastor
Head of Data Challenges
Enterprise DNA

5 Likes

The Brief

Congratulations to our Power BI Team , your excellent work in Challenge 20 has earned more trust from stakeholders. Enterprise DNA in collaboration with Funnel, would borrow your talent now!

Enterprise DNA mission is to empower Power BI and Power Platform users to change their world. Its YouTube channel comprehensively covers how to utilize all areas of Power BI and the Power Platform to unleash powerful analytical insights from your data.

Funnel, funnel.io, is a fast-growing tech company within digital marketing. With a focus on non-technical users, it builds a new generation of Software as a Service (SaaS) that helps their customers draw spot-on conclusions from their business data.

Enterprise DNA provides its YouTube channel data now. The objective is to understand its audience better and have a further strategy to drive more channel engagement. This is an Exploratory Data Analysis (EDA), feel free to explore the dataset and let us know what you can find and what you think are the most important aspect of your findings.

About the dataset

One Excel Workbook - YouTube Channel data

Data-dictionary

Brief in PDF format

Important Read!!

From Enterprise DNA CEO – Sam McKay

Thank you for engaging in this project with us. We have provided you with a real sample data exported from Funnel.

Our project start date is 11/07/2022 and your final reports must be submitted by the 11/08/2022 at 23:59 UK Time (GMT+1) .

Report Developer Role

It is your job as an analyst to prepare an exploratory analysis report about EDNA YouTube Channel growth!

Your report, due to remote work and Enterprise DNA wanting its employees being able to view reports via mobile phone, must include a Power BI mobile layout view .

Reports are not limited by the number of pages or techniques. Feel free to use all the techniques at your disposal – tooltips, drill throughs, page navigations, etc.

Submission of entries

To be considered within the competition, entries are due no later than 23:59 UK Time (GMT+1) Thursday, August 11, 2022.

If you are not already following Enterprise DNA on LinkedIn, please do so and join our challenge group at

How to submit:

Email the completed PBIX file to

powerbichallenge@enterprisedna.co

federico.pastor@enterprisedna.co

Take an image of your report and post it to the Enterprise Challenges Group

If you are a platform member, take an image and the “Publish to Web URL” of your report, then post them to the Enterprise DNA forum. If you are not a member of Enterprise DNA learning platform do the same in the Enterprise DNA Challenges Group.

Take the image plus URL and post them on LinkedIn tagging Enterprise DNA to say, “I accepted the Enterprise DNA challenge.” . Please use the following tags.

#EDNADataChallenge & #EDNAYoutubeVideosReporting

We always encourage all participants to do a brief description of how they approach the project and share their experience of participating in the challenge and sharing it on the forum/social media.

If you need any help with publishing, please reach out to one of the team for assistance, post in the forum/LinkedIn group or email to federico.pastor@enterprisedna.co

Conclusion

A great opportunity to learn a valuable skill of being able to produce and calculate Production and Forecast Reports within Power BI.

The techniques covered here are massively reusable across the board.

Any issues or questions, please reach out.

Primary Dataset

Dataset_C21.zip

Secondary Datasets

Secondary Datasets_C21.zip

9 Likes

Excited to get involved in this one!

And seeing some outstanding analysis from everyone.

4 Likes

Hi, I’m excited for the freedom of this brief. I think it’s a great brief for my fist challenge attempt. Question about the Subscribers data through, in the dataset the subscribers gained and subscribers lost are attributed to a specific video. but is this actually for the subscribers for the EDNA channel as a whole? I wasn’t aware you could subscribe to particular videos, i thought subscribers were just for the channel.

1 Like

@ErikaLil

Thanks for your question and participation, let me find out for you.

Back asap.

Federico Pastor

@ErikaLil

Hi Erika,

As you well mention, subscribers are just for the channel and no individual video. Therefore it works as a whole for the channel. Perhaps you can focus your attention to what year and month we have more gained and or lost subscribers and or give your own interpretation.

I hope this helps.

Federico

1 Like

Hi Platform Members

IMPORTANT NOTICE

Message from EDNA CEO - Sam McKay

We hope everyone had so much fun with EDNA Youtube channel data this week! If you have not, it is a good time to start now!

This week, Enterprise DNA CEO has passed us some additional data - which will be released on Monday 18th July 2022! Please keep :eyes::eyes::eyes: on our updates next week, it will be added on your reporting development.

Thanks

Federico Pastor

4 Likes

Hi, what does the card click rate percentage relate to? Dividing the Card Clicks by Views creates a different percentage to that in the Card Click Rate column.

Do all videos have cards attached? Do the cards cover the same topic?

1 Like

@stevens

Hi Steve,

Thanks for your question, the card click rate refers to the average card click per impression. This meausres how often viewers clicked a card after seeing it.

Please check this video out for futher information.

I hope this helps.

Federico

1 Like

Ah, this helps a lot, thank you!

Erika

2 Likes

Hello,

I started analyzing the data and I am just wondering, should take entire dataset as is or should I do some cleaning if I find it suitable?
I have found 2 issues so far

There is this strange new ad video

That has 100 times more views than average but no likes, shares etc.
I assume this is paid ad that is shown on other youtube channel and is not avaible on youtube channel? As I also cannot find it on youtube

Other thing I am not sure about it is some videos are missing IDs

Should I came up with some random id just to have something for this challenge needs?
I though I can use video title as primary key perhaps but there are duplicates in that columns so that won’t work

What is your take on that one in case of those challenges?

1 Like

@piniusz

Hi, as the brief mentions this an Exploratory Data Analysis. There is not direct requirements by EDNA Youtube team therefore, it is for you to discover insights, bring up what, it is in your view, the most relevant information and ensuring your processes and findings are well documented.

Any thing you do, please make sure to document it in the report or your write up in the forum.

I hope this helps.

Federico

IMPORTANT READ

Dear Platform Members,

Please go to the he Brief” , at the bottom you can see the new datasets under the name “Secondary_Datasets_C21” click on it and download the data files. These files are important and provide some extra information for your report.

From EDNA’s CEO – Sam McKay

There is a txt document called “Guide_C21_Secondary Dataset” in the zip file, please read it.

The zip file containing this data can be found in the challenge Brief under the name of “Secondary_Dataset_C21” or at the bottom of this “Important Notice”.

These are.

  1. Cities

  2. Geography = Countries

  3. Viewer Age Ranges

  4. Viewer Gender

The files are self-explanatory. Any problems please do not hesitate to post a comment in the forum.

Thanks and Regards,

Federico Pastor
PS. Just in case…

Secondary Datasets_C21.zip

@FPastor - couple of questions on the dataset:

  1. On the Geography data - the location appears to be a mix of countries and states. For example, US appears to be the highest, but there looks to be data for each of the states as well. I would anticipate that other locations fall under other regions as well (as IN, AU, GB, are presumable India, Australia, and Great Britain). Is there any additional information to separate these out?

  2. On the Cities data, there only appears to be 5 cities - so this doesn’t correspond with the geography data as you would expect to see a long list of cities. Any clarification on this data?

Thanks!

2 Likes

Hi @tweinzapfel ,
To see the names of the countries I downloaded the information of the ISO_3166-1_alpha-2 encoding with this query:

let
Source = Web.BrowserContents(“https://es.wikipedia.org/wiki/ISO_3166-1_alfa-2#Tabla_de_decodificación”),
#“Extracted Table From Html” = Html.Table(Source, {{“Column1”, “TABLE.wikitable.sortable:nth-child(23) > * > TR > :nth-child(1)”}, {“Column2”, “TABLE.wikitable.sortable:nth-child(23) > * > TR > :nth-child(2)”}, {“Column3”, “TABLE.wikitable.sortable:nth-child(23) > * > TR > :nth-child(3)”}, {“Column4”, “TABLE.wikitable.sortable:nth-child(23) > * > TR > :nth-child(4)”}, {“Column5”, “TABLE.wikitable.sortable:nth-child(23) > * > TR > :nth-child(5)”}, {“Column6”, “TABLE.wikitable.sortable:nth-child(23) > * > TR > :nth-child(6)”}}, [RowSelector=“TABLE.wikitable.sortable:nth-child(23) > * > TR”]),
#“Promoted Headers” = Table.PromoteHeaders(#“Extracted Table From Html”, [PromoteAllScalars=true])
in
#“Promoted Headers”

Then combine it with the Geography data and match the 210 rows

In the information of the cities, in the Table Data tab there is only information of the Top 500 cities and they add up to 7646 views.
In the Chart Data tab, as it says, there is only information on 5 cities with a total of 3945 views and in the Total tab the 10,839,316 views appear. This totals information matches the totals in the Geography table.

In this case, we need some help.

Regards,

2 Likes

Hi @FPastor What if we submit the report after the deadline? Would it be accepted or rejected?

1 Like

@jafernandezpuga & @tweinzapfel

The tables are to be worked out separately as disconnected tables, it is in the guide doc. You’re both veterants so work it out :slight_smile:

Just in case this inspire your artistic side :slight_smile:

As “a friend of mine one said - there is nothing wrong in the data, you just need to find what is good” or GIGO.

Federico

2 Likes

@MudassirAli

Can I have your CC please :slight_smile:

Gotcha!!!

Federico

1 Like

Hi everyone, this is an entry submitted by Monika Spylczyn sent to us via email.

Here’s how Monika described it:

It was my first time ever analysis of social media content; found it very interesting

Congratulations Enterprise DNA for the incredible channel growth

You may view the full report here:
Monika Spylczyn

Please feel free to give Monika your feedback on her report.

4 Likes

Hi everyone, this is an entry submitted by Aman Kumar sent to us via email.

Here’s how Aman described it:

This is my first submission to EDNA Challenges.​

While making the report I learned about the usage of tooltips and multi-page navigation feature in Power BI which I haven’t tried out yet

You may view the full report here:
Aman Kumar

Please feel free to give Aman your feedback on his report.

2 Likes