Just to double check, I’m ok to submit my report Sunday evening UK time?
2 Likes
Spot on David. 
2 Likes
Hi @MehdiH,
“ job complete ” is the time the patient has been handed over from the care of the paramedic to the hospital.
As for your length of call question- I think this is just because of the data anonymisation nothing to do with the process.
Thanks,
H
2 Likes
Loving the submissions so far everyone.
Hoping to post mine in the next 24-48 hours hopefully.
Sam
3 Likes
Super deign Zoe! Nice work
1 Like
Thank you
1 Like
Here is my submission to Challenge 14.
I have serious illness in my family. I haven’t been able to do any work on the challenge over the past few days. I doubt I’ll be able to do any work over the next few days.
Accordingly, I haven’t been able to any navigation or icon work.
John Giles
Challenge 14 - John Giles.pbix (730.8 KB)
6 Likes
Very sorry to hear that. I hope all everyone is OK and recovers swiftly.
Thanks very much for jumping in and participating in the challenge. I particularly like how you structured your KPIs page.
Best to you and your family,
- Brian
1 Like
Hi @JohnG…just had a quick look at your report, really like it and given the constraints you mentioned it’s a super effort.
Wish you and your family my best at this tricky time.
David
2 Likes
I will receive all criticism and suggestions gladly.
I’m eager to see the metrics that others devised. To me, it seemed that they were very basic.
I concede that colors and navigation are topics I need to address.
Regards,
John Giles
Truly sorry to hear that and my thoughts and prayers are with you and your family. Wishing you all well.
Appreciate the determination and courage to participate.
Looking forward to seeing you on the next one.
If there is anything at all I can do to support in the interim do not hesitate to ask.
Best Wishes,
Haroon
1 Like
Brian:
I don’t know if this is acceptable, but I found a “rogue” shape while taking one final spin through my PBIX.
I’ve attached the version after I removed it.
John Giles
Challenge 14 - John Giles.pbix (730.6 KB)
3 Likes
I just recorded a live stream on Enterprise DNA TV, working through my submission.

I had to cut it short so this is just PART 1. Might finish up part 2 tomorrow
Emergency Services Insights - Completed Model.pbix (329.2 KB)
Also above is a more refined model, if you want a head start on your own development. You can use my model to skip a lot of the query editor and data model work. Not all but most of it.
Chrs
Sam
3 Likes
@JohnG ,
Sure - that’s no problem. We definitely don’t want rogue shapes wandering around the Challenge unchecked… 
- Brian
2 Likes
Everyone,
Attached is my submission. Wanted to get this out before heading out on vacation.
Challenge 14 (Weinzapfel).pbix (8.3 MB)
(@BrianJ - if you are able to publish this, that would greatly appreciated)
Excited to have caught this one having missed #13. With every challenge, I usually set a couple of goals/new skills to accomplish. For this one:
-
I wanted to create a visual using the “Charticulator” custom visual. This is by far my favorite custom visual yet requires some learning curve. So this was a great opportunity to use this. [Visuals are on 3rd picture below; chart on right side - there are actually 3 in total although two are toggled between bookmarks]
(@sam.mckay - perhaps a training series on Charticulator?) -
Given the time data – I wanted to use the “Timeline by Queryon” custom visual (credit to Brian Julius for showing this previously)
Also - with most of my visuals now going forward, I always try and add a help/information view that Guy in a Cube showed a while back (example in last picture below). And - with every report that I do - some tooltips added in here and there.

The technical details
ETL Notes
- Added an index column in Power Query
- Added a category of patient ages categorize them based on age ranges
- For the protocol table – added a shorted one for visualization purposes.
- A duplicate fact table created to track call segments. This was used for the “Timeline by Queryon” custom visual
Report Features
Overall:
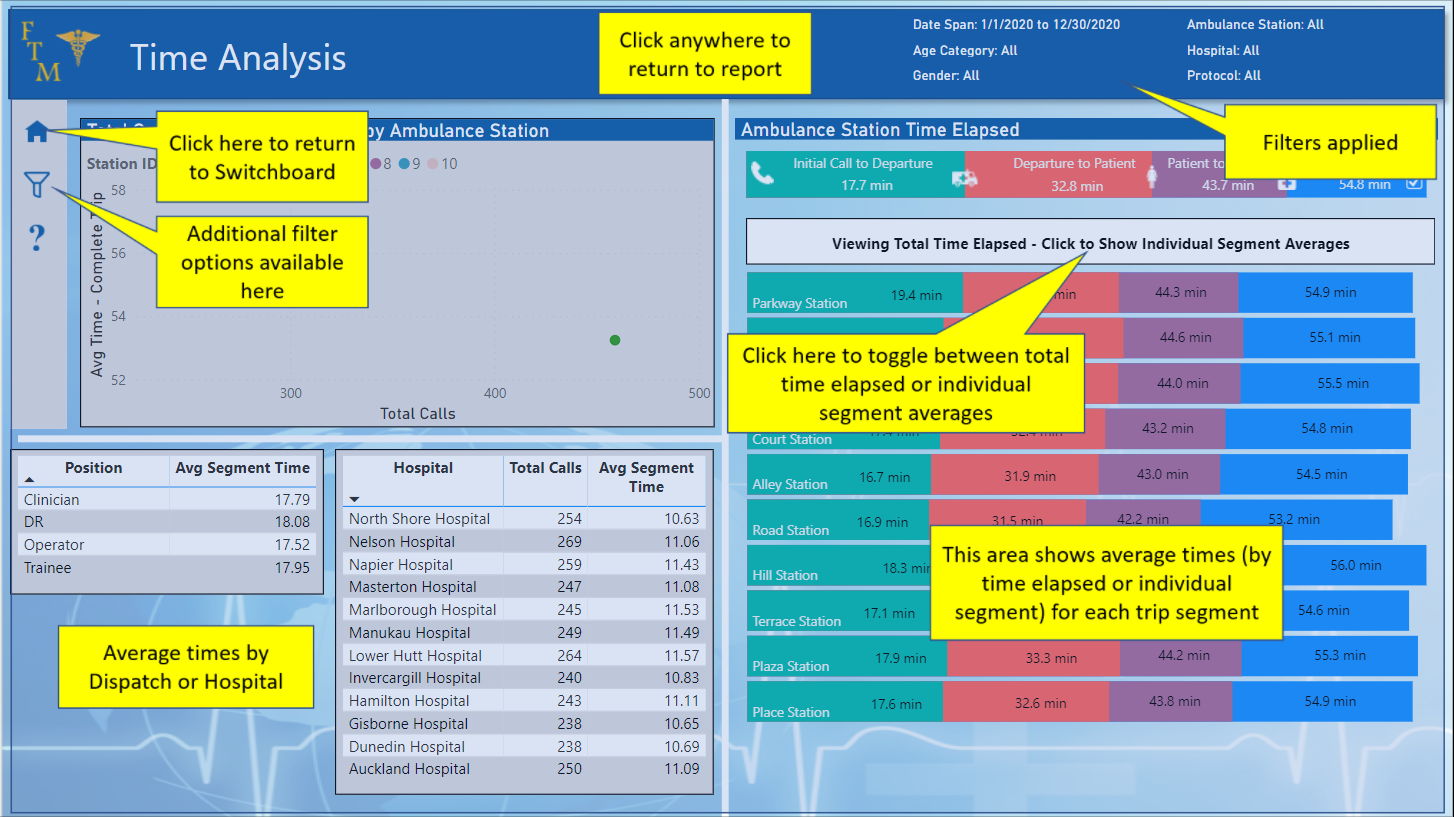
• Slicer panel on every page; Panel appears/disappears to save space. All slicers are synced across the pages; Filters applied are shown on the top right of each page
• Each page has an information sheet. On the left side navigation bar, there is a question mark that will toggle this (credit for this technique goes to Guy in a Cube)
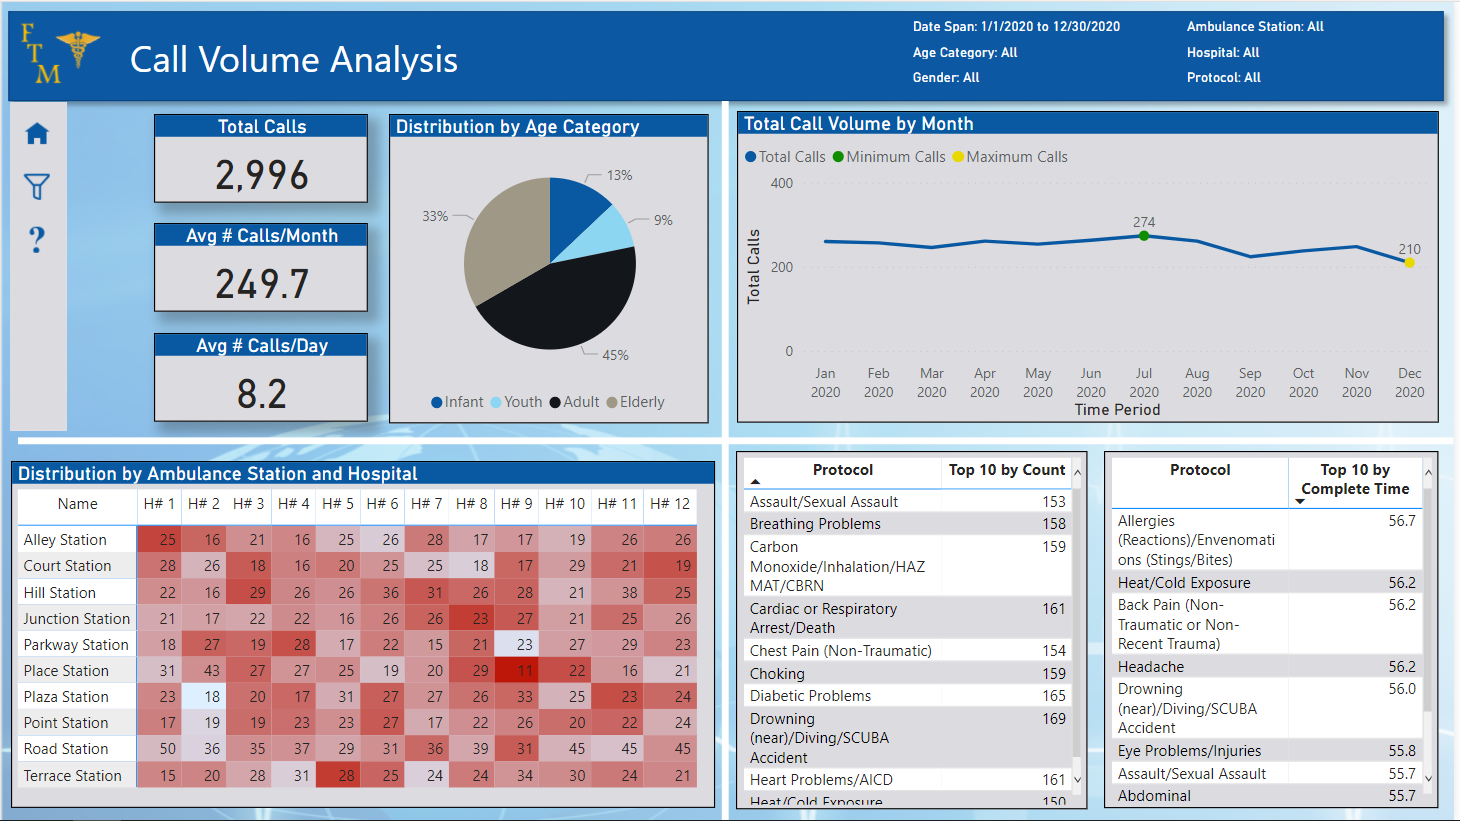
Volume Analysis:
• Call Volume by month will show min and max amounts (technique was one from a WoW challenge - http://www.workout-wednesday.com/power-bi-challenges/)
• Ambulance/Hospital matrix has tooltips to provide more detailed information
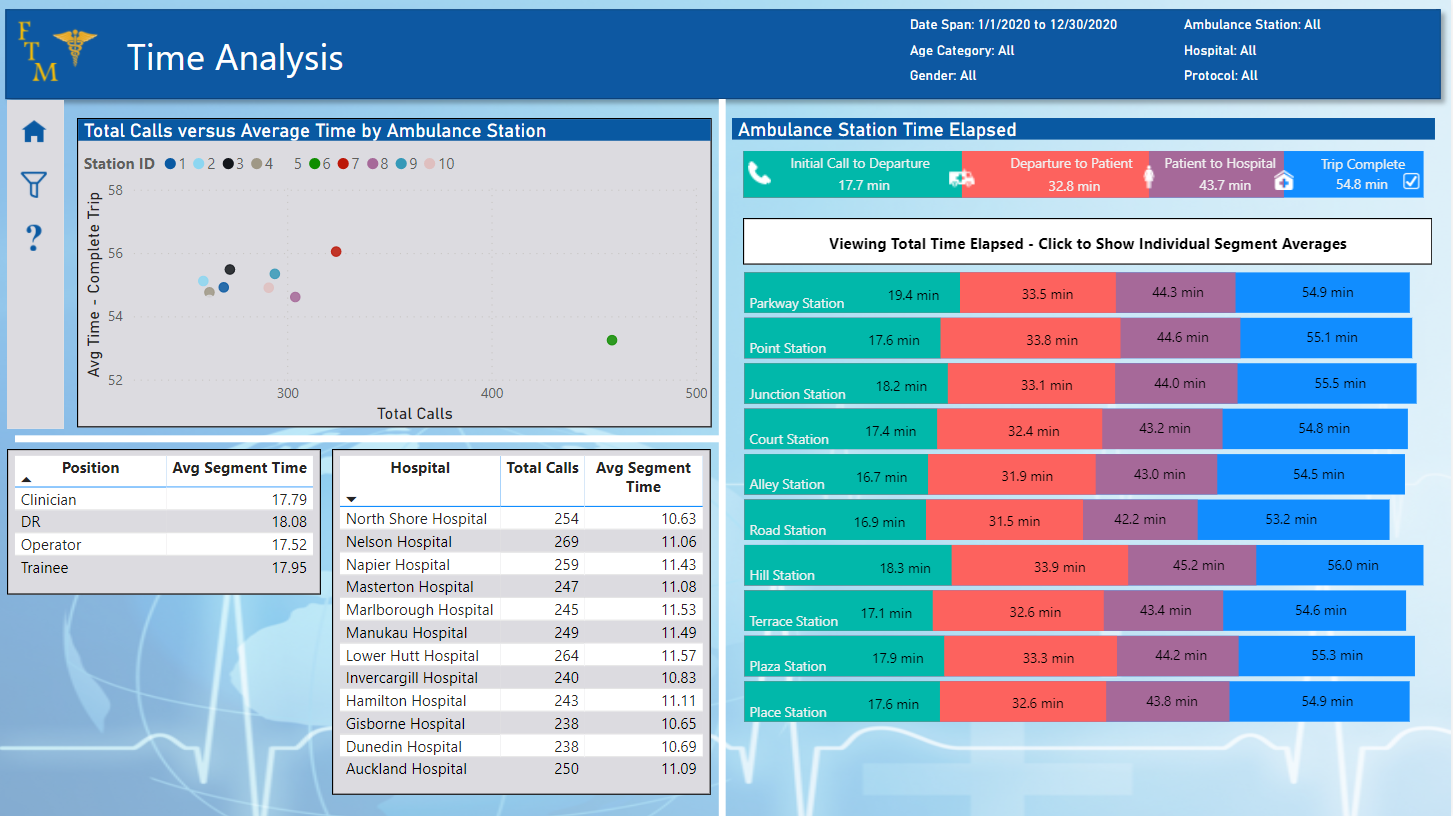
Time Analysis:
• “Charticulator” used to show averages by each segment (right side visual); there are 3 different visuals here with the top one being an overall average and then a section below to show breakdown by station. There are buttons to toggle between total time elapsed versus the individual segment averages for this lower section.
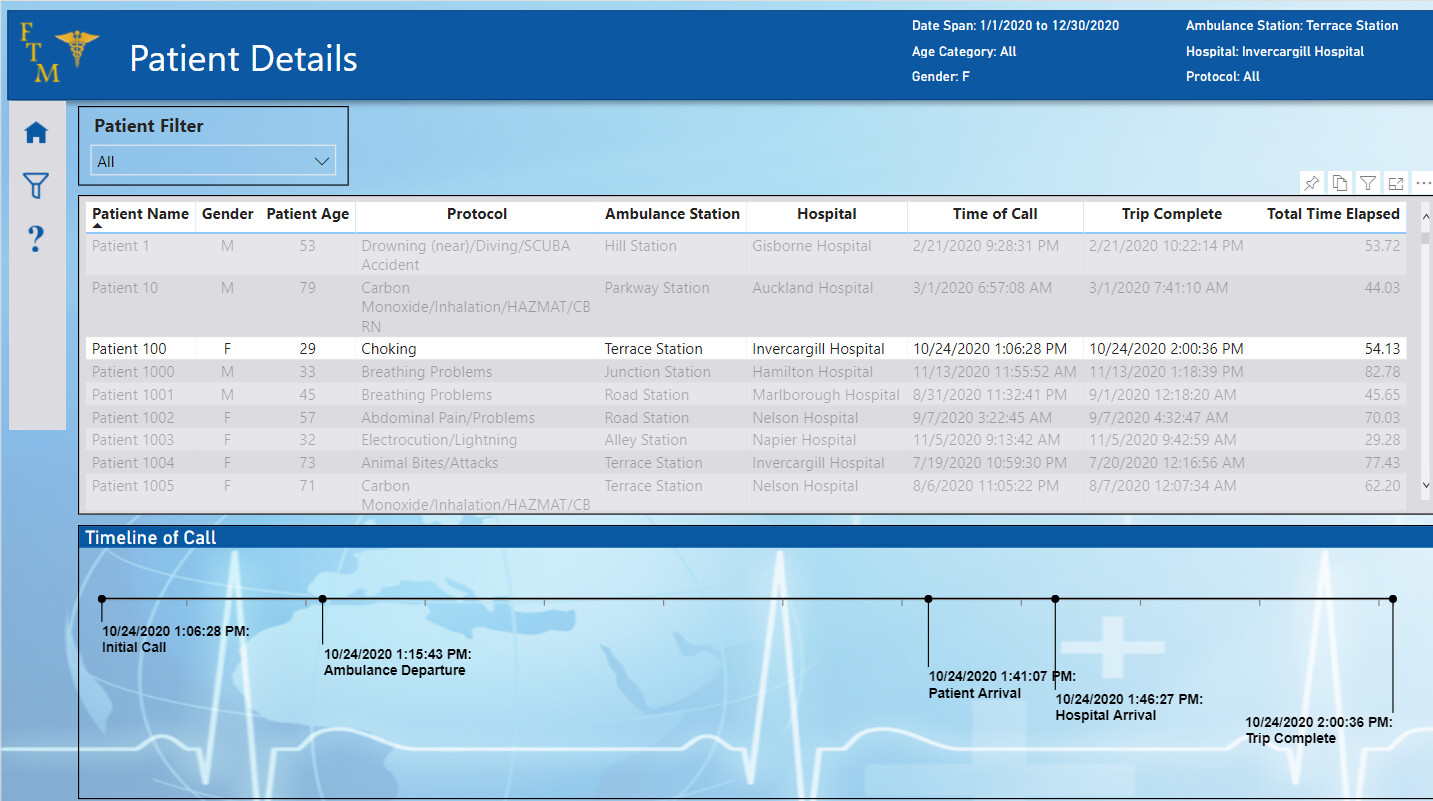
Patient Page:
• “Timelime by Queryon” used to display timeline of call. This only works well if one patient is selected. Thus a message is displayed when not. Technique for this credited to Excelerator BI (https://exceleratorbi.com.au/show-or-hide-a-power-bi-visual-based-on-selection/)
Additional Credits
-
Power BI Tips Youtube Channel for great videos on Charticulator https://www.youtube.com/channel/UCPwPrIpZwlfIKcoUpRwl9OQ
-
https://www.iconsdb.com/white-icons/ for all the icons in the report.
6 Likes
Love your submission! Prior to seeing your submission, my model design was similar. I added an index to the fact table and focused on the response time segments in my reporting. However, I really like the Timeline by Queryon that you used vs the column chart that I used. Great job!
3 Likes
Absolutely dynamite entry! Really well-organized – provides a wealth of information without overwhelming the viewer. Great use of a wide range of creative visualization techniques, including an excellent application of QueryOn Timeline (a personal favorite…). Also really like the incorporation of the GIAC help overlay,
All-around great submission. ![]()
![]()
Here’s the Publish to Web link:
Re: your suggestion on an Enterprise DNA series on Charticulator - we got you covered. Check out @MudassirAli 's excellent Advanced Visualization Techniques platform course part two – the entire course focuses on developing custom visualizations using Charticulator.
Have a great vacation!
- Brian
2 Likes
All,
Per @tweinzapfel 's message above, if you don’t have Publish to Web capability but would like your report published, just let me know and I’m happy to publish it via the Enterprise DNA tenant and send you to PTW link to add to your post/writeup.
- Brian
1 Like
Hi Brian!
Can you publish my submission to the web? I submitted via the email address earlier today.
Thanks! DianaWill
1 Like
@BrianJ - thanks for publishing and the great feedback! And I’ll be sure to check out that video series (I’m vastly behind!).
@DianaWill - definitely looking forward to seeing yours.
2 Likes