I was unable to reply to your post Category effect on total pay gap so I’ll pick it up here.
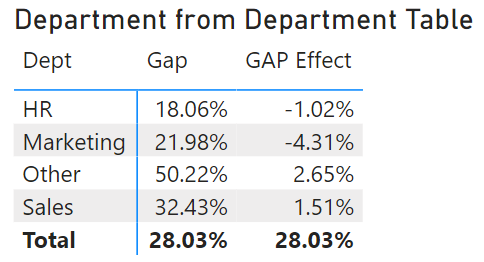
The problem is related to the filter context, particularly how it interacts with your GAP Effect measure.
In DAX, the filter context is often determined by the dimensions used in your visualizations, and different measures may react differently to these contexts. In your original GAP Effect measure, the use of functions like ALL and ALLSELECTED doesn’t isolate the effect of each department on the overall gender pay gap, which is why you weren’t getting the results you wanted.
Use an iterator to calculate the gap for each department.
Below is a revised version of your GAP Effect measure:
GAP Effect Iterative =
VAR CurrentDept = SELECTEDVALUE(Employees[Changed Type.DeptKey])
VAR AllDepts = VALUES(Employees[Changed Type.DeptKey])

VAR OverallGap =
    CALCULATE(
        [Gap],
        ALL(Employees)
    )

VAR DeptEffect =
    SUMX(
        AllDepts,
        IF(
            Employees[Changed Type.DeptKey] = CurrentDept,
            OverallGap - CALCULATE([Gap], ALL(Employees), Employees[Changed Type.DeptKey] <> CurrentDept),
            BLANK()
        )
    )

RETURN
    DeptEffect
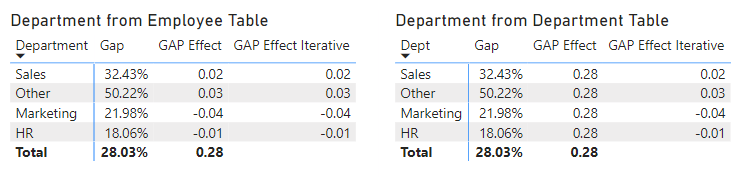
It’s designed to work at the department level, so it won’t return a value for the overall total in a table visual. If you wanted one, just modify it to include a condition that checks if it’s being evaluated at the total level.