Hello All,
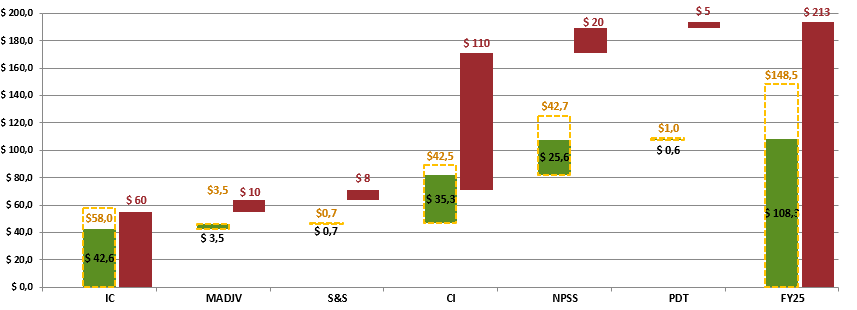
Does anyone have a solution to cascade Waterfalls the same way as shown below , I thought about using R for doing this , basically each bars represent categories : R
Red bar are Targeted values
Green Bar are Actuals values
Doted gold bar are actuals values with a risk factor applied.
I can provide underlying table if anyone could help me get the same look and feel into power BI.
Hi @johannphill, we aim to consistently improve the topics being posted on the forum to help you in getting a strong solution faster. While waiting for a response, here are some tips so you can get the most out of the forum and other Enterprise DNA resources.
-
Use the forum search to discover if your query has been asked before by another member.
-
When posting a topic with formula make sure that it is correctly formatted to preformated text </>.
-
Use the proper category that best describes your topic
-
Provide as much context to a question as possible.
-
Include demo pbix file, images of the entire scenario you are dealing with, screenshot of the data model, details of how you want to visualize a result, and any other supporting links and details.
I also suggest that you check the forum guideline https://forum.enterprisedna.co/t/how-to-use-the-enterprise-dna-support-forum/3951. Not adhering to it may sometimes cause delay in getting an answer.
Hi @johannphill, due to the length by which this post has been active without response, we are tagging it as Solved. For further questions related to this post, please make a new thread for better visibility. Thanks!