Hello @acnyc88,
Thank You for posting your query onto the Forum.
To achieve the “Cohort Analysis” results I followed the steps as provided below -
1. Added a calculated column Month Year -
Month Year =
FORMAT( 'Transaction Details'[dateStamp] , "MMM YYYY" )
2. Added a calculated column Year Month Number -
Year Month Number =
VALUE( FORMAT( 'Transaction Details'[dateStamp] , "YYYYMM" ) )
3. Added a calculated column Year Month Order -
Year Month Order =
RANKX(
    'Transaction Details' ,
    'Transaction Details'[Year Month Number] , ,
     ASC ,
     Dense )
4. Finally created a “Cohort Revenue” measure -
Cohort Revenue =
VAR _Transaction_Month =
SELECTEDVALUE( 'Transaction Details'[Year Month Order] )

VAR _Selected_Cohort_Month =
SELECTEDVALUE( 'Months Out'[Value] )

VAR _Current_Customers =
VALUES( 'Transaction Details'[PartnerID] )

VAR _Past_Customers =
CALCULATETABLE( VALUES( 'Transaction Details'[PartnerID] ) ,
    ALL( 'Transaction Details'[Month Year] , 'Transaction Details'[Year Month Number] ) ,
        'Transaction Details'[Year Month Order] < _Transaction_Month )

VAR _New_Customers =
EXCEPT( _Current_Customers , _Past_Customers )

VAR _New_Customers_Count =
COUNTROWS( _New_Customers )

VAR _Customer_Cohort_Months =
CALCULATETABLE( VALUES( 'Transaction Details'[PartnerID] ) ,
    ALL( 'Transaction Details'[Month Year] , 'Transaction Details'[Year Month Number] ) ,
        'Transaction Details'[Year Month Order] = _Transaction_Month + _Selected_Cohort_Month )

VAR _New_Customers_Buying_In_Cohort_Months =
INTERSECT( _New_Customers , _Customer_Cohort_Months )

RETURN
CALCULATE( SUM( 'Transaction Details'[amount] ) ,
    ALL( 'Transaction Details'[Month Year] , 'Transaction Details'[Year Month Number] ) ,
        'Transaction Details'[Year Month Order] = _Transaction_Month + _Selected_Cohort_Month )
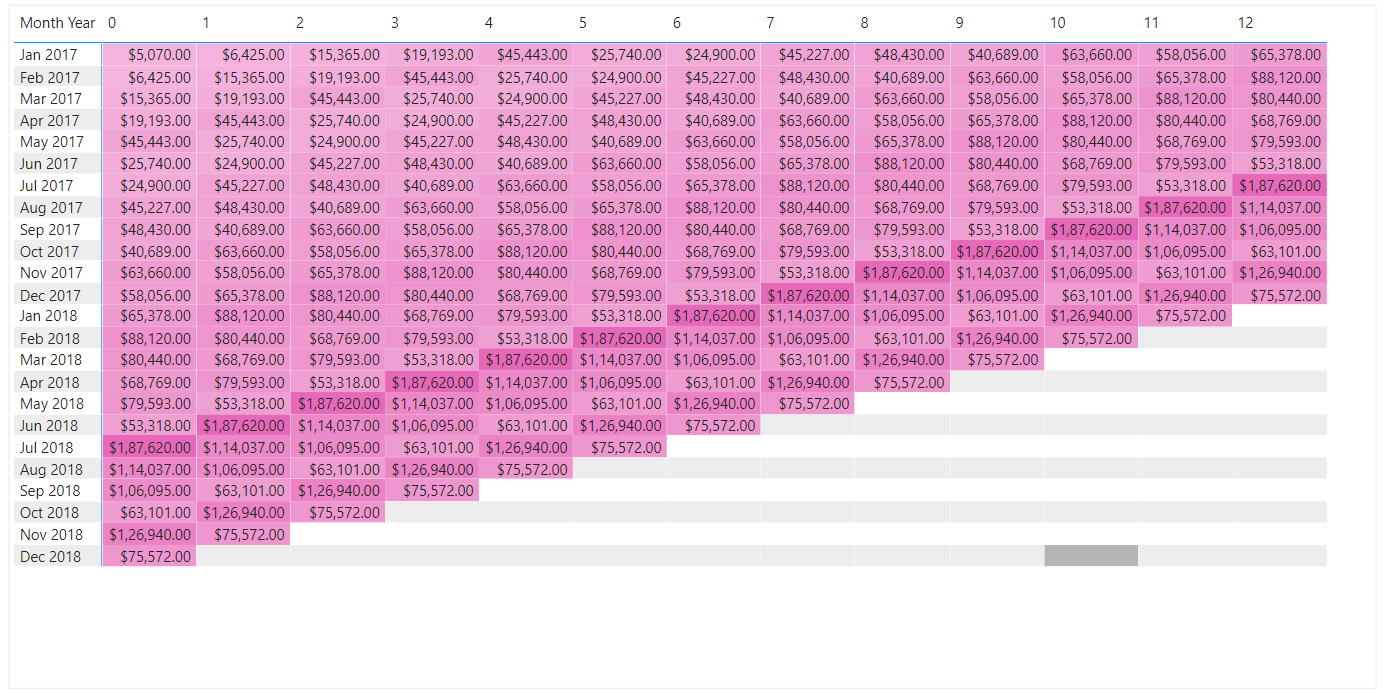
Once the “Cohort Revenue” measure is created in the matrix visual drag the “Month Year” column from the Transaction Details table into the rows section and drag the “Value” column from the Cohort Month table into the columns section and put the created measure into the values section. So now we get the results as per the screenshot provided below -
Now, if you observe carefully you’ll see that all the results are same in a diagonal direction.
Why did this actually happened? Is the formula correct? - “Yes, it’s absolutely correct”.
So is there a problem with the data? - “No, data is also good to go”.
So where’s the problem actually? -
So ideally the Cohort Analysis will provide the consistent results in a diagonal direction. The reason is the numbers are considered as is while performing the “Cohort Analysis” i.e. the “Amount” column from the Transaction Details table has been considered and nothing else.
So what happened here? -
The verticals represents “Month n Year” whereas the horizontals represents the “First Month of Revenue” i.e. in case of Jan’17 the first month is itself Jan’17 but from subsequent months i.e for Feb’17 the first month of revenue will be treated as Feb’17 under “0” and Mar’17 will be treated as “1” and this will go on. And therefore, due to this as the month passes by the diagonal results will be showcased same. So ideally considering “Cohort Analysis” just for the Revenue will absolutely not make any sense since results will be all same in the diagonal direction.
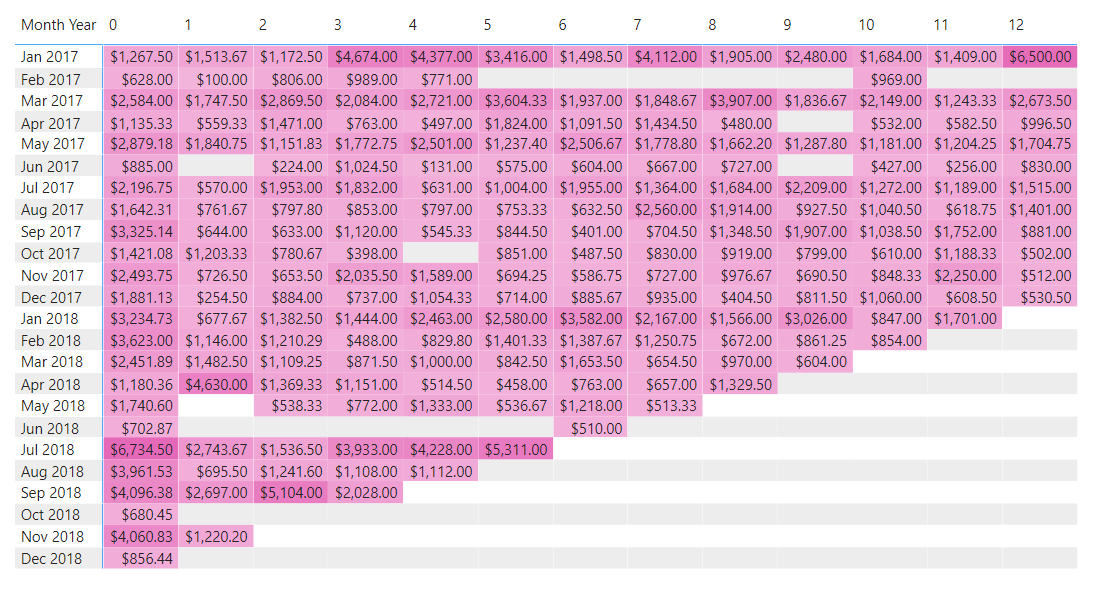
Rather than having this kind of results, what you can actually do here is consider having an cohort analysis on “Average Revenue From New Customers” then having an analysis on “Revenue From New Customers”. So below is the measure provided for the reference -
Cohort Average Revenue =
VAR _Transaction_Month =
SELECTEDVALUE( 'Transaction Details'[Year Month Order] )

VAR _Selected_Cohort_Month =
SELECTEDVALUE( 'Months Out'[Value] )

VAR _Current_Customers =
VALUES( 'Transaction Details'[PartnerID] )

VAR _Past_Customers =
CALCULATETABLE( VALUES( 'Transaction Details'[PartnerID] ) ,
    ALL( 'Transaction Details'[Month Year] , 'Transaction Details'[Year Month Number] ) ,
        'Transaction Details'[Year Month Order] < _Transaction_Month )

VAR _New_Customers =
EXCEPT( _Current_Customers , _Past_Customers )

VAR _New_Customers_Count =
COUNTROWS( _New_Customers )

VAR _Customer_Cohort_Months =
CALCULATETABLE( VALUES( 'Transaction Details'[PartnerID] ) ,
    ALL( 'Transaction Details'[Month Year] , 'Transaction Details'[Year Month Number] ) ,
        'Transaction Details'[Year Month Order] = _Transaction_Month + _Selected_Cohort_Month )

VAR _New_Customers_Buying_In_Cohort_Months =
INTERSECT( _New_Customers , _Customer_Cohort_Months )

RETURN
CALCULATE( SUM( 'Transaction Details'[amount] ) ,
    ALL( 'Transaction Details'[Month Year] , 'Transaction Details'[Year Month Number] ) ,
        'Transaction Details'[Year Month Order] = _Transaction_Month + _Selected_Cohort_Month ,
            'Transaction Details'[PartnerID] IN _New_Customers_Buying_In_Cohort_Months ) / COUNTROWS( _New_Customers_Buying_In_Cohort_Months )
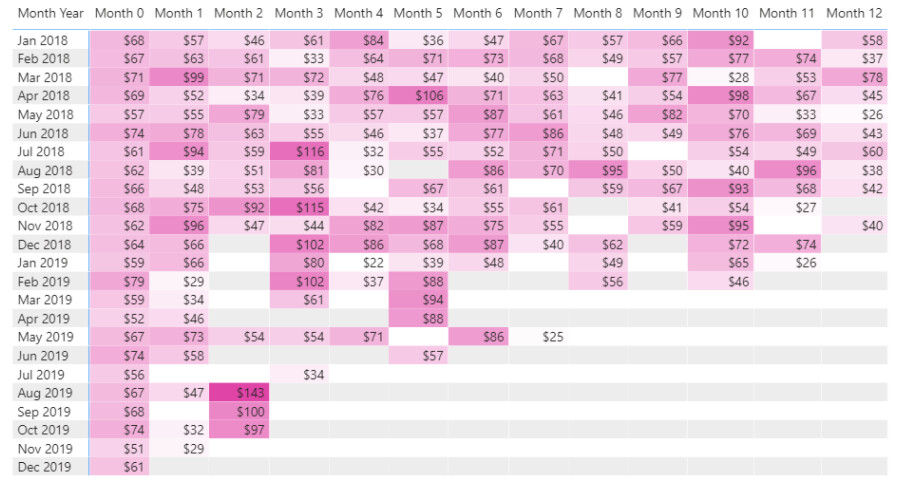
Now, if we see the results it’ll start to make more sense than the previous results. Below is the screenshot of the result provided for the reference -
The choice is absolutely yours here. You can go with either of the results depending upon the scenario that you’ve in your analysis.
I’m also attaching the working of the PBIX file for the reference.
Hoping you find this useful and meets your requirements that you’ve been looking for. 
Thanks and Warm Regards,
Harsh
Cohort Analysis - Harsh.pbix (355.0 KB)