I am trying to show the columns of three tables in a ‘table’ visual. When I show columns from ContactGroup and RentAgreementEpisode tables, the table visual displays them. However, when I tried to bring in a column (let’s say GroupName) from ContactGroupDetail table it throws an error message i.e. 'Can’t display because Power BI does determine the relationship between two or more fields" as shown in the image:
I checked all three tables to make sure that there is no value missing in columns that connect the table to other tables.
I created a measure to display the name of GroupName as shown below:
GroupName - Measure = MAX(ContactGroupDetail[GroupName])
It worked fine and display GroupName information. I could not understand why I could not use the GroupName column directly to table visual. Is there any issue with my data model? Why did I need measure to display the information? Please direct me to where I am making the mistake and any advice to fix the issue would be highly appreciated.
Maybe I don’t understand your problem correctly, but I am able to drag literally every field in the table, as you can hopefully see in the attached file.
If it does throw an error on your PBI desktop, maybe you could let me know what your report settings are or make sure to have the most up to date version of PBI installed.
Thanks for your reply. It’s really wired. I used your attached file and you are right that table visual shows almost all columns from all tables. As soon as I created my own table visual it threw the same error as shown below:
It looks like I got up to date version of Power BI desktop:
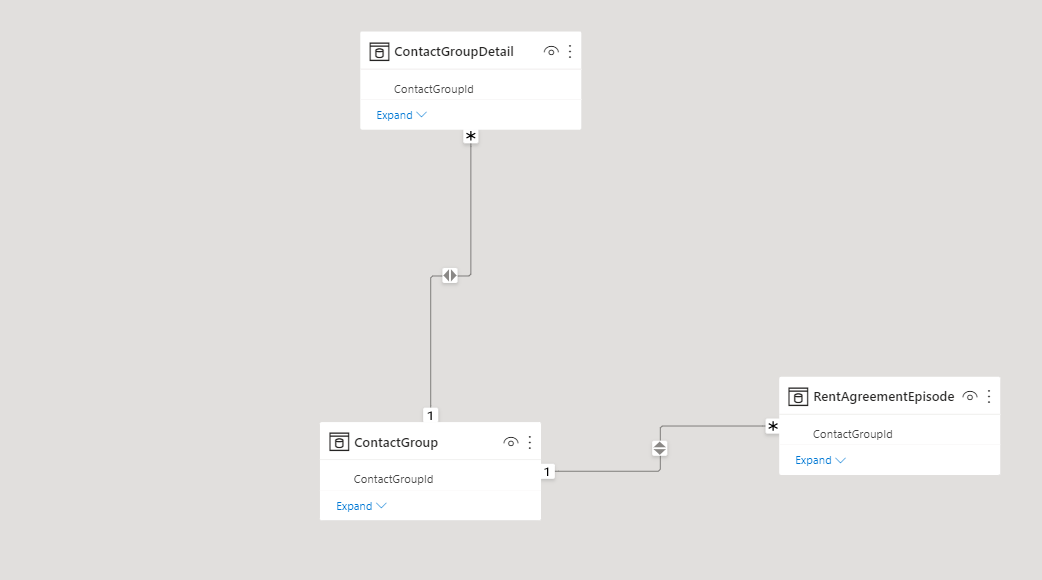
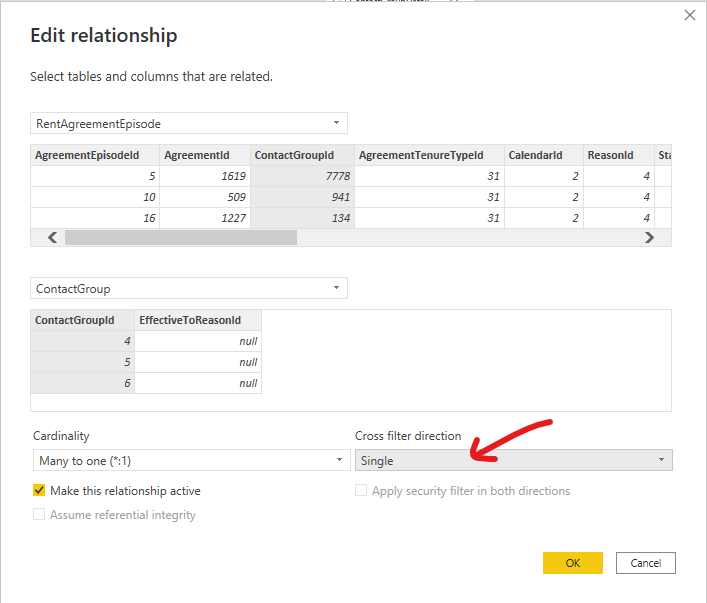
Most of the time this error means that a visual has two columns from different tables with no relationship between them. But, it can also happen when using bi-directional filters. The tables are related, but Power BI can’t figure out how to manage the cross-filtering…
You should change the crossfilter direction from “Both” into “Single”.
Your issue is that you are trying to bring data from three different tables into the visual, and there is not a clear connection (with two bi-directional filters going on) between ContractGroupDetail and RentAgreementEpisode.
As @Melissa mentions above, you also have bi-directional filters, which are rarely recommended, and then ONLY if you have a very strong grasp of what they will do in your model.
Your solution of a measure for the contract group name is probably the best one in this case, unless you want to build a bridge table, another solution (if you don’t have too many columns in the ContractDetail table) would be to merge ContractDetail into ContactGroupDetail and work with only two tables for this portion of your report.
I also recommend HIDING the columns on your fact table that connect to the dimension table (makes it easier when needing to pull in the correct columns and avoid mistakes in visuals for both you and any report designers using your model down the road).
Note: in case anyone was wondering, the reason that @DashboardingMeesters was able to pull in all of the fields is because they included the name measure you created - which forced the relationship between the tables to resolve.