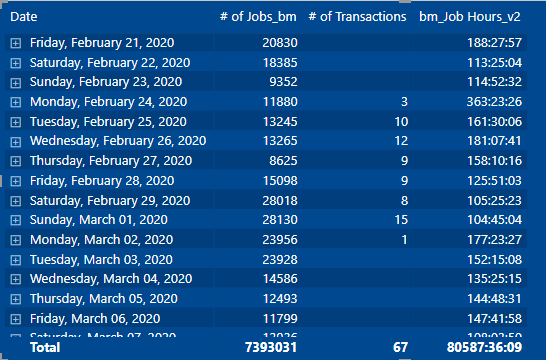
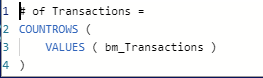
I have this matrix, and a measure called ‘# of Transactions’ that is showing values for the corresponding dates in the row header. I believe this matrix is currently showing all the dates available in the filter context, with ‘Blanks’ on rows that do not return a ‘# of Transaction’ value. Is it possible to have a slicer that toggles, on or off, a modifier in the ‘# of Transactions’ measure so the matrix visual returns only the rows with values for the ‘# of Transactions’ measure? Maybe using Field Parameters?
Hi,
You can use dax to achieve this if you do not want balnk in table or if you want that on some selection just create a table and based on table selection use the appropriate dax.
Hoping i am clear to you.
Thanks,
Anurag
Hi @Anurag, thanks for the feedback. I like the sound of making a new table selection. But what is the most efficient dax to do I do that?
Hi @Schreg.
As with most things in Power BI, there are multiple ways to display only those records with transactions; here’s 2:
(1) Using Slicer:
- create a new table ([Has Transactions], in my example) with 2 rows: 1/0, Yes/No
- create a calculated column in your data table
Has Transactions = IF( Data[# of Transactions] > 0, 1, 0 ) - use the modelling view to link the Has Transactions[ID] column to the Data[Has Transactions] column
- add a slicer for the [Has Transactions] table to the canvas
(2) Using Filter Pane:
- Select your table, and in the filter pane, use Advanced Filtering to test whether the Data[# of Transactions] field is greater than 0
Hope this helps.
Greg
eDNA Forum - Jobs Transactions Hours.pbix (25.8 KB)
1 Like
Hi @Greg ! thanks for the reply. In your second point, “create a calculated column in your data table”, my fact table, ‘bm_Transactions’, has 13M+ rows, and the [# of Transactions] in my matrix is a measure:
Does your solution still apply? Curious about the efficiency of creating a calculated column on a high cardinality dataset. Also using DirectQuery that’s sourcing the table from SQL Server.
Hi @Schreg. Your original post didn’t mention the use of a measure nor DQ. You’re right, as a general practice you would use measures as opposed to calculated columns, especially for fact tables/large datasets. Your screen shot only showed a dozen rows or so, so the quickest and easiest thing I could think of was a calculated column.
You’ll have to evaluate further in your own environment to pursue the performance implications.
As the data is coming from SQL Server, why don’t you use SQL to create a view containing the calculation and hopefully obviate the issue and return all data necessary for your visual?
Hope it helps.
Greg
Thanks for the feedback @Greg !
Sorry for not disclosing all the info in the original post. Another disclosure is that I’m using query folding at the table source settings in power query.
I’m not great at SQL, just enough to be a bit dangerous. And I also don’t own the database, so I’m not allowed to make views. I wish I could make them because I would imagine they would help stop the “exceeded 1000001 rows” errors I keep getting on most of my visuals.
Any suggestions on next steps from here?
Nope … give your view requirements to you DBA I guess and see what they can come up with.
For the row count errors on you visuals, consider another database view that already does base aggregations, as these should prevent the errors (and make the visuals respond faster, to boot, which your users will appreciate).
Greg
Hey @Greg, great news, I communicated with my DBA and he can create the views I need! But, how do I know which views I need? Do I know by looking at my visuals? What part? Any resources on eDNA that talk about how to align SQL Views to PBI visuals?
Hi @Schreg. Nope, not at all. I’d probably start by creating an Excel mock-up of the data table you want to display in your visual, then iterate with your DBA until the view returns the data you want to see.
Greg
so are the aggregations done on the sql view as well?
If possible, yes (SQL can do it easily, but if the granularity of your target Power BI visual is lower than the SQL aggregation, then perhaps aggs in SQL is not the right/necessary solution). Only you and your DBA can decide after reviewing your data and target visuals.
Greg
Hi @Schreg, just want to check the status of this query. Did the response provided by the users and experts help in solving your query? If not, how far did you get and what kind of help you need further? If yes, kindly mark as solution the answer that solved your query. Thanks!
hi @EnterpriseDNA , thanks for the follow-up. My query was not resolved. We got as far as, ‘ask your DBA for help’. I have 13M+ rows on my fact table and experts here say to create views on my SQL Server. Creating views became another query, which also was recommended to ask my DBA.