Probably something pretty easy but I cannot really figure out what to use and if it is possible.
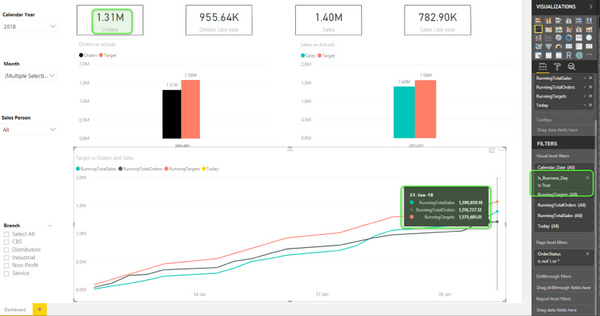
I have a visual which shows my ordertotal/sales/targets.
That works nicely but I added a visual filter to the graph to only show business days.
I realized that some orders are raised on holidays and saw a mismatch between my numbers.
It must be something with the ALLSELECTED() but not sure if I can just eliminate that one visual filter from my calculation so that it shows the right final value even though I only “show visually” the business days.
I would like that I have something link ALLSLICERSBUTNOTVISUALFILTERS() as function if you know what I mean. Would there be a workaround for this scenario?
Thats exactly the problem now. So there is that mismatch which I do not want as from
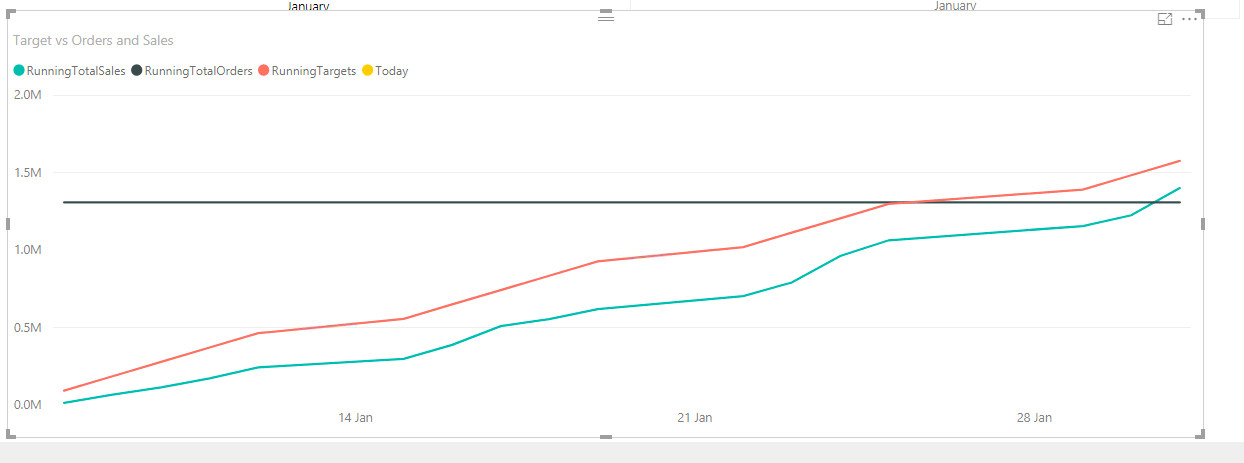
a visualisation point of view, I would like to have the targets (red line) which I have set only on
working days to be as smooth as possible, thats why I eliminate the non-business days from the visual.
The sales and order values should only listen to the slicer, not the visual filter.
I could not get it working with ALLEXCEPT() as this seems to give different results.
What I’m going to recommend though is that you don’t use the visual level filter here.
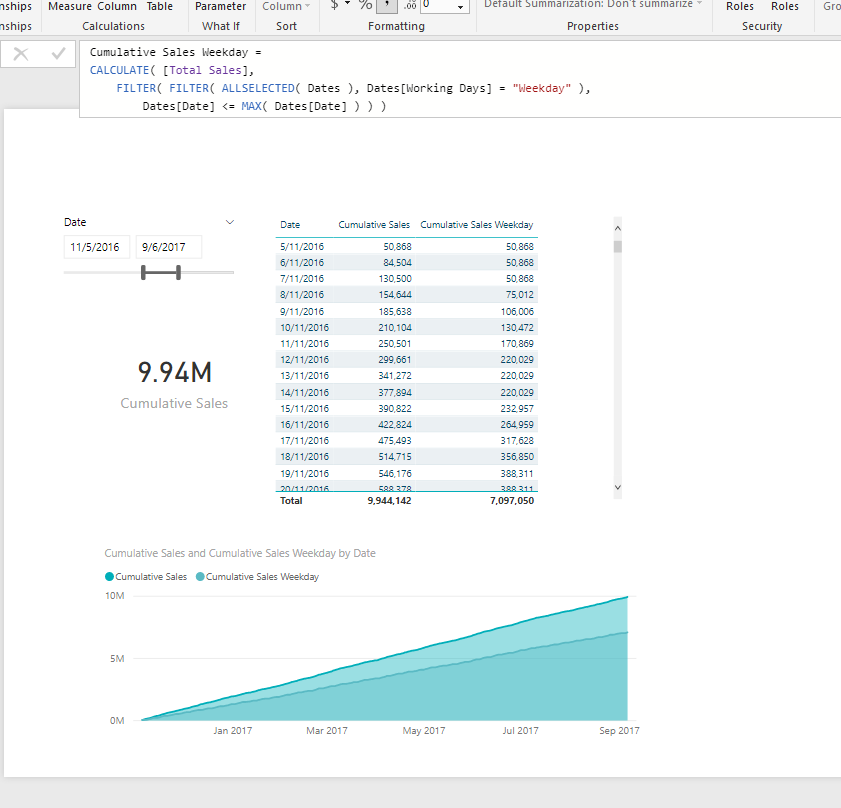
You should create a measure that returns what you need instead. So your targets measure should be written differently to your other measures to take the weekday/weekends logic into account.
Thanks for your guidance here. I am still learning.
Looking at your formula, this does not give the right value as what I likely
want to achieve is just a correct value for the total orders, even though I filter the
graph visually using the business days, this to leave out dates with weekends etc.
So the last formula calculates the sales value, only on weekdays, but I actually just
want to have the full sales values but have the graph filtered on business days.
So was wondering, as I just cannot really see a way at the moment, if i should somehow create a second table which I use to filter the graph and not use the date table which I use for the calculations? as the visual
filter in this case influences the calculations.
Not sure if I just want to much but just trying to understand what is possible! and was a bit “shocked” seeing that the values were not correct which made me realize that I have to be carefull just easily using filters!
Yes definitely need to be careful with these formula. They are great when used well BUT you have to be careful, because your consumers on the online service will likely not know what is filtered.
So you need to be very clear what you are doing with this filters
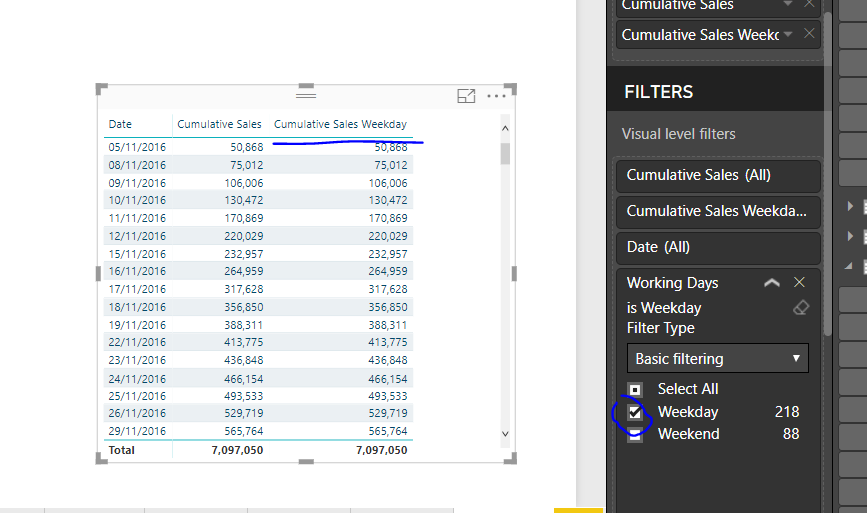
I do want to show you something interesting though
You’ll see here, that one is calculated in the DAX formula and the other is being filtered by the visual level filter.
You see though they have the same values.
I would always recommend completing the calculation in the formula though with a correct measure name, so it’s obvious what values your are calculating and showing