Calculating Work Days Between Dates

I know this question has been asked a bunch of times before, but I think I have a unique nuance to the question. We use Zendesk in our business and I am trying to calculate the average number of work days it takes between when a ticket is created and when it’s solved. Based on this video by Brian, I was able to come up with this script:

Avg Work Days To Solve = 

AVERAGEX( 'Zendesk Ticket Metrics',
Calculate(  
    COUNTROWS( 'Date Table' ),
    DATESBETWEEN(
        'Date Table'[Date],
        'Zendesk Ticket Metrics'[Ticket Created Datetime],
        'Zendesk Ticket Metrics'[Solved Datetime wUnsolved]),
    FILTER(
        'Date Table',
        'Date Table'[DayOfWeekName] <> "Saturday" &&
        'Date Table'[DayOfWeekName] <> "Sunday"
    ),
    ALLSELECTED( 'Zendesk Ticket Metrics' )
)        
)

When I export the data to Excel and do my own calculations, the above creates the exact same result as subtracting the two dates in Excel and adding 1. However, if I were to use the NETWORKDAYS function in Excel, it results in a lower average than what the above DAX formula returns. My hypothesis, therefore, is that I am not correctly removing “Saturday” and “Sunday” in the DAX formula.

Any help would be greatly appreciated.

@ChrisHervochon,

If you could provide a PBIX/sample dataset for testing, that would be great but in the interim give this a go:

Create a separate measure:

Work Days Between = 

Calculate(  
    COUNTROWS( 'Date Table' ),
    DATESBETWEEN(
        'Date Table'[Date],
        'Zendesk Ticket Metrics'[Ticket Created Datetime],
        'Zendesk Ticket Metrics'[Solved Datetime wUnsolved]),
    FILTER(
        'Date Table',
        'Date Table'[DayOfWeekName] <> "Saturday" &&
        'Date Table'[DayOfWeekName] <> "Sunday"
    )

)

Then rewrite the main measure as

Avg Work Days To Solve =
CALCULATE(
    AVERAGEX( 'Zendesk Ticket Metrics', [Work Days Between] ),
    ALLSELECTED( 'Zendesk Ticket Metrics' )
)

Please let me know how this goes.

  • Brian

Thanks, Brian. Unfortunately, the measure now returns a result of “1”.Data.xlsx (105.0 KB)

Attached is the dataset. I also adjusted the Days Between formula to include the MIN and MAX functions as the original formula was throwing an error.

Work Days Between = 

Calculate(
COUNTROWS( ‘Date Table’ ),
DATESBETWEEN(
‘Date Table’[Date],
MIN(‘Zendesk Ticket Metrics’[Ticket Created Datetime]),
MAX(‘Zendesk Ticket Metrics’[Solved Datetime wUnsolved])),
FILTER(
‘Date Table’,
‘Date Table’[DayOfWeekName] <> “Saturday” &&
‘Date Table’[DayOfWeekName] <> “Sunday”
))

@ChrisHervochon

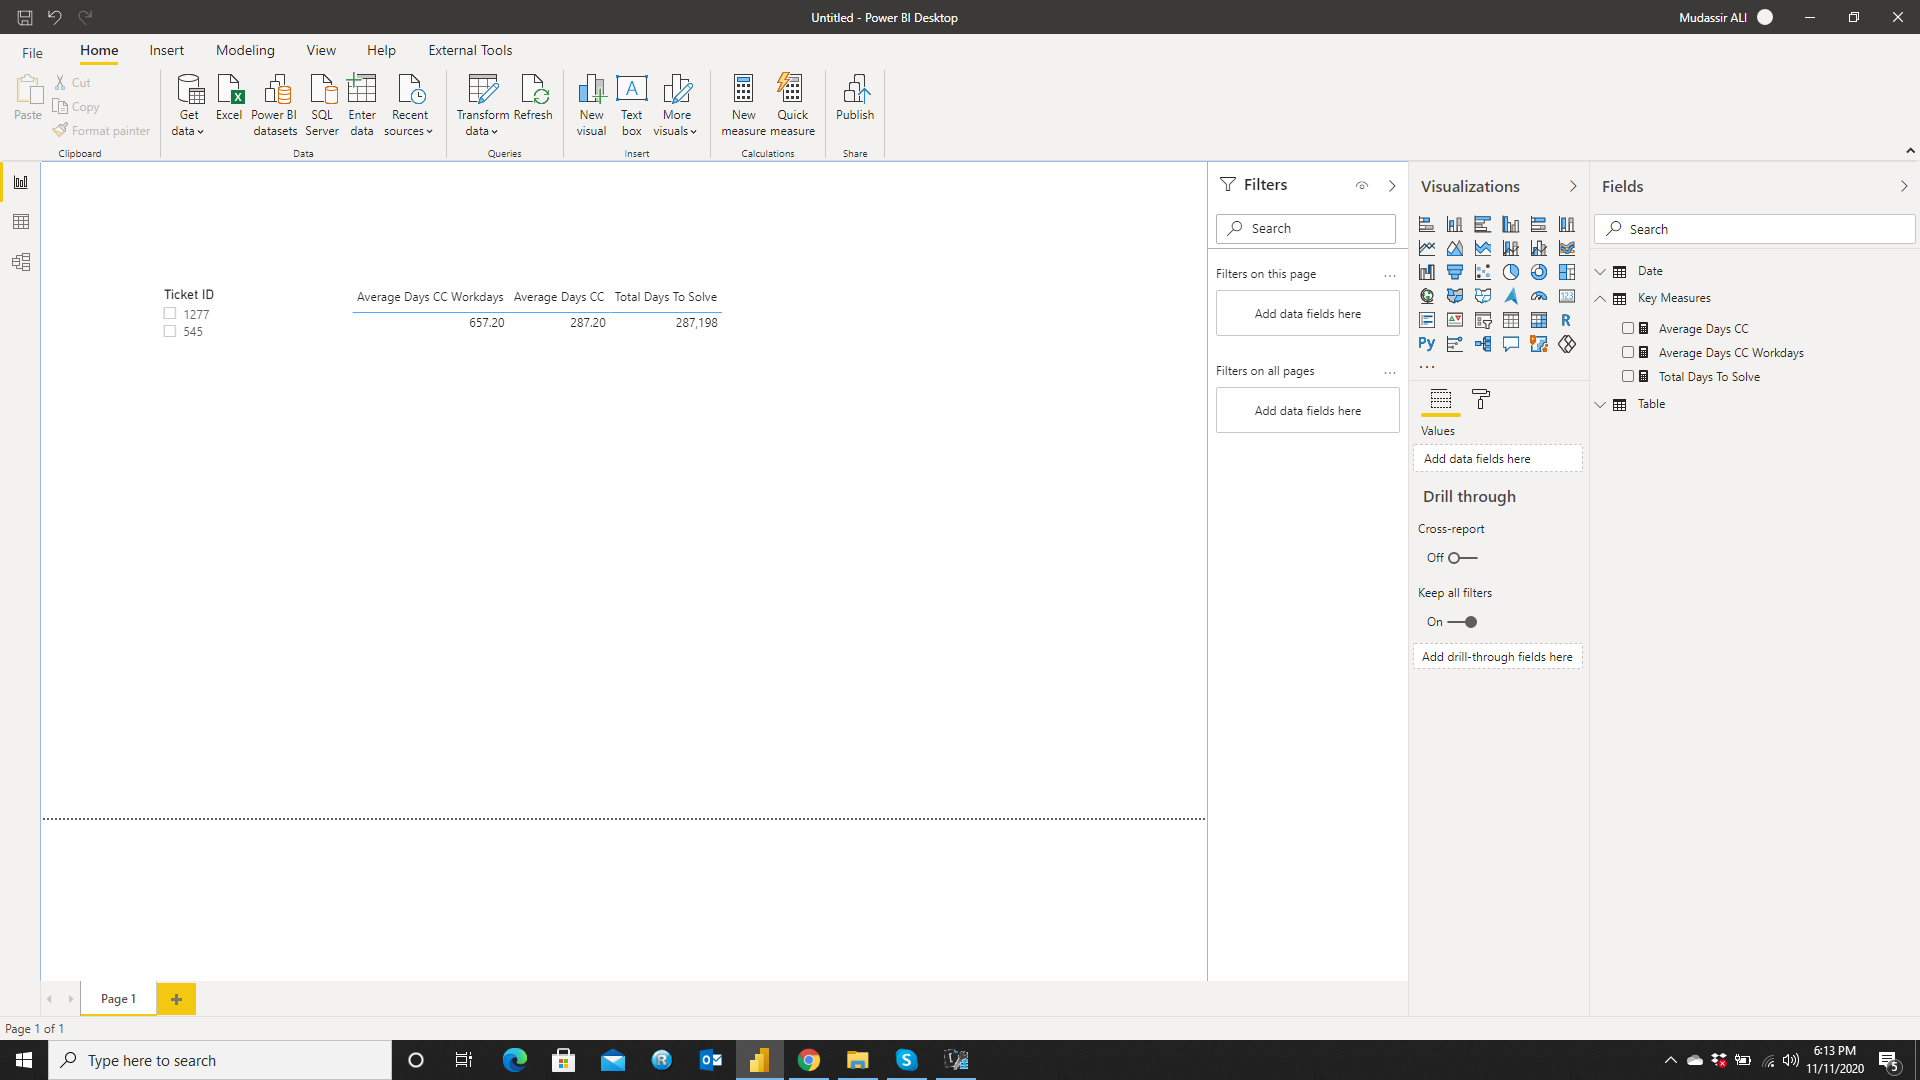
How about creating a calculated column and getting the days by subtracting the Solved Date from Tickets Created Date and then getting the Average?

The Created Date/Time was first transformed into Create Date (Date Format) in Power Query and then created a calculated column using

Days To Solve =
DATEDIFF(
‘Table’[Ticket Created Date],
‘Table’[Solved Date],
DAY)

Then calculated the Average using the measure

Average Days CC Workdays =
VAR TotalDaysToSolve = [Total Days To Solve]
VAR DaysExcludingWeekends =
CALCULATE (
COUNTROWS ( ‘Date’ ),
FILTER (
ALL ( ‘Date’[DayOfWeek] ),
‘Date’[DayOfWeek] <> 0
&& ‘Date’[DayOfWeek] <> 6
)
)
VAR Result =
DIVIDE ( TotalDaysToSolve, DaysExcludingWeekends )
RETURN
Result

The final result is as follows:

Let us know if this is what you are looking for.

Attaching the PBIX & Source file.

Workdays between Dates.pbix (129.0 KB)

Data.xlsx (105.0 KB)

Thanks.

I wasn’t quite able to get either of the above solutions to work. However, I did find a custom M function which works very nicely here: https://www.thebiccountant.com/2020/02/20/date-networkdays-function-for-power-query-and-power-bi/

Then, I used AVERAGEX on the new column to return the result. Thanks to all for the help and feedback!

@ChrisHervochon

Glad that you found the solution. Can you share what your final result is?

Thanks.