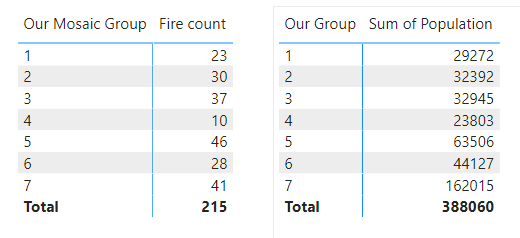
Hi, I have been struggling to calculate some form of Weighted Average for 7 incident groups (“Our Mosaic Group”) based on property(population) size on a different table.
I’m ideally looking to rank the incidents count based on the “weight” of the property size
So instead of counting the no of incidents per group, I’m looking to weigh it based on the population size : “Properties” on a different table.
Table 1 (Fire data) has incidents and Table 2 (Groups Data )has the property size.
The relationship:
Linked by Mosaic type field
The formula I used is this:
weighted Average =

DIVIDE(

SUMX('Fires Data cleaned 2', [Count of Incidents] * RELATED('Groups Data'[Properties])),

SUMX('Fires Data cleaned 2',[Count of Incidents] )

)
But I wanted to check that it is the right way of looking at it.
Attached is my pbix fileSegmentation annon.pbix (204.9 KB)
Hi @Ikay, we aim to consistently improve the topics being posted on the forum to help you in getting a strong solution faster. While waiting for a response, here are some tips so you can get the most out of the forum and other Enterprise DNA resources.
Use the forum search to discover if your query has been asked before by another member.
When posting a topic with formula make sure that it is correctly formatted to preformatted text </>.
Use the proper category that best describes your topic
Provide as much context to a question as possible.
Include the masked demo pbix file, images of the entire scenario you are dealing with, screenshot of the data model, details of how you want to visualize a result, and any other supporting links and details.
Group 1 weigthed =
VAR Group1Count =
    CALCULATE (
        COUNT ( 'Fires Data cleaned 2'[Fire count] ),
        'Fires Data cleaned 2'[Our Mosaic Group] = "1"
    )
VAR Group1Populaion =
    CALCULATE ( SUM ( 'Groups Data'[Population] ), 'Groups Data'[Our Group] = "1" )
RETURN
    DIVIDE ( Group1Populaion, Group1Count, 0 )
“Related” function won’t work in your case as there is a mismatch b/w names in “Mosaic Type” in Fires Data and Group Table and the Relationship is setup using this. For example
Groups Data - L50 Renting Rooms,O63 Single Essentials Fires Data - L50 Renting a Room, O63 Streetwise Singles
Thank you so much @ankit for pointing that out. I’ve amended the Groups Data to match. I’m not sure the using the dax above solves it, because its making Group for more than the rest, when it has the least No. of Incidents and least Population size (using this on live data). I have attached the amended pbix file
Also, I’m not sure if its possible but Ideally, I’m looking for just one Dax code that can be filtered by the groups and sorted according to the highest, instead of having multiple dax code for each group.
Hi @Ikay, did the response provided by the users and experts help you solve your query? If not, how far did you get and what kind of help you need further? If yes, kindly mark the thread as solved. Thanks!
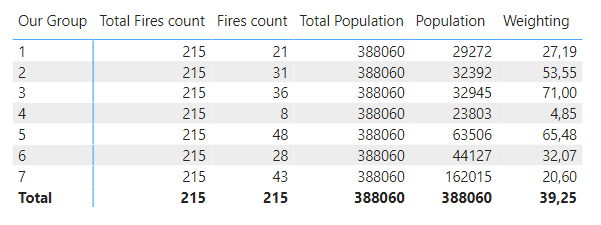
I’m really sorry for late response What I sent was using real data. But you are right. there are 2 different figures, so I’m essentially looking for a way to “rank” or “weight” the Incidents counts on the “Fire Data Cleaned” table (what I sent), using/based on the sum of population on the “Groups data” table.
Think I’m still a bit lost here but let’s see what you make of this.
If this is not moving in the right direction then post a mock up based on this sample file. Thanks
Fires count =
COUNT( 'Fires Data cleaned 2'[Our Mosaic Group] )

Total Fires count =
CALCULATE( COUNT( 'Fires Data cleaned 2'[Our Mosaic Group] ),
    ALLSELECTED( 'Date Table' ),
    ALLEXCEPT( 'Fires Data cleaned 2', 'Fires Data cleaned 2'[Date of Call] )
)

Population =
SUM( 'Groups Data'[Population] )

Total Population =
CALCULATE( SUM( 'Groups Data'[Population] ),
    REMOVEFILTERS( 'Groups Data' )
)