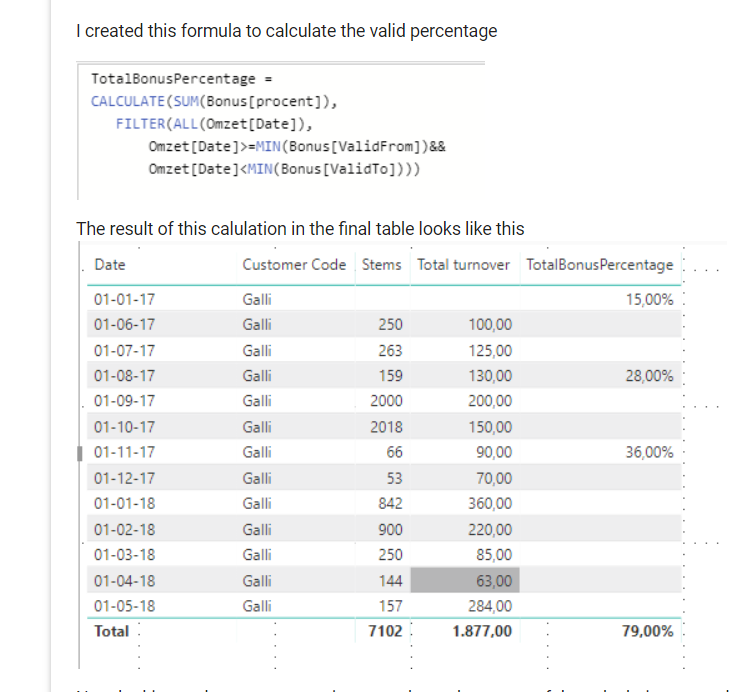
Ok I think it’s this part below that needs to be optimized
I think you need to make sure you are using the date column within your measures and within the table itself to provide the right context on the calculated result.
The problem you have I think, is that you are attempting to jump from one fact table to another within the same measure which isn’t going to work.
Have you looked through this pattern called the ‘events in progress’ pattern.
You will want to use this one to allocate the correct % value through time for each agent. You can then look to use this to divide the total amounts.
Here’s an idea of the pattern below. You see that I use the date table column within it.
Sales in Progress =
CALCULATE( SUM( 'Sales Data'[Total Revenue] ),
	FILTER( VALUES( 'Sales Data'[OrderDate] ), 'Sales Data'[OrderDate] <= MAX( Dates[Date] ) ),
	FILTER( VALUES( 'Sales Data'[Ship Date] ), 'Sales Data'[Ship Date] >= MIN( Dates[Date] )))
It’s actually a little different to yours, so definitely check out the video first to understand how to use it.
As I saw this is how you can allocate the correct percentage across dates. Then you just need to use this as your denominator in your calculation.
Can you try this and let me know how it goes. Thanks
Sam